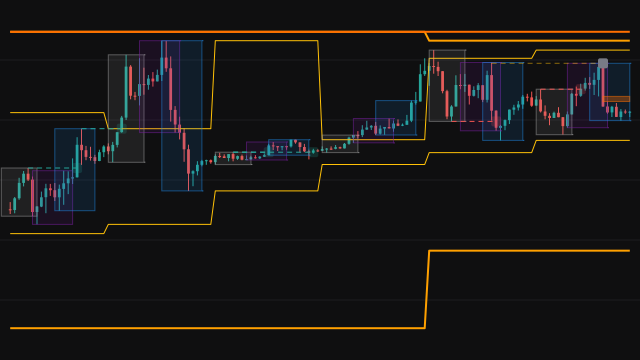
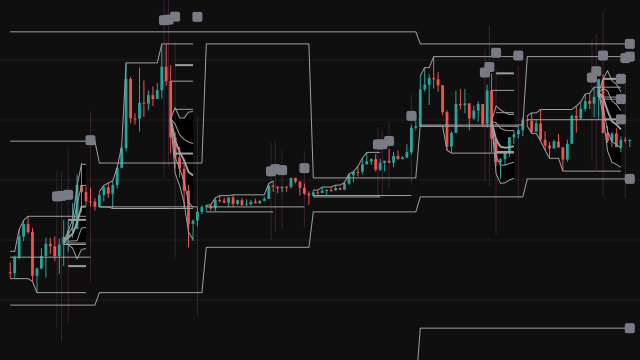
Magnetic Zones turns the previous higher timeframe bar into a ladder of price levels for the current one. On the first chart bar of each new day, week or month, the study takes the previous period's high and low, marks their midpoint as the pivot, and places resistance levels above it and support levels below it at 0.236, 0.786, 1.618, 2.618, 4.236 and 6.618 times the previous period's range. These are the six pairs SR1 to SR6.
SR1, SR2, SR4 and SR6 each carry a buffer box around both levels, a band one eighth of the gap to the neighbouring level on either side, so a level reads as a zone rather than a single price; SR3 and SR5 are drawn as lines only. SR1 also gets a wider box spanning from just above R1 to just below S1, the area around the pivot. The previous period's high and low (PDHL) and the pivot are drawn as lines. Three timeframes can be drawn at once, each with its own line style and its own count of past periods to keep. A timeframe code is blank for the chart itself, a number for minutes, or D, W or M; day, week and month periods follow the chart's own calendar.
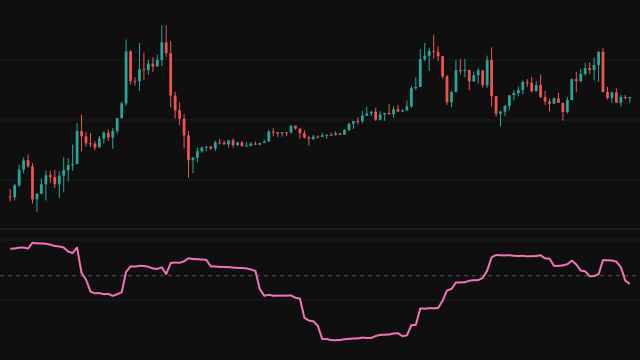
Four optional overlays share the chart. Two moving averages, exponential (seeded with a simple average) or simple, can run on the chart's bars or on a folded higher timeframe, in which case every chart bar reads the value the previous higher timeframe bar closed with. An anchored VWAP restarts each day, week or month, and a Supertrend ratchets its bands against the previous close and flips direction on the current close.
How to read Magnetic Zones Multi-timeframe
Read the zones as a ladder of reference prices for the current period, measured from where the previous period traded. The SR1 box around the pivot covers the middle of the previous range, about 0.3 of its width on each side of the midpoint. SR2 sits beyond the previous high and low, about 0.29 of the previous range outside them, so price at SR2 has already left the last period's range. SR3 to SR6 sit 1.618 to 6.618 previous ranges from the pivot and are reached only when price travels far beyond the previous range. The previous high and low lines show where the last period's range ended.
The levels are fixed for the whole period once its first bar prints, so they never move intraday. They describe the previous period's range, not a forecast, and on a quiet previous period the zones sit close together and are crossed often. The moving averages, the VWAP and the Supertrend add a trend read beside the ladder; none of them changes where the zones are drawn.
Settings
- Zones 1 Timeframe
- The higher timeframe the first set of zones is measured from: blank for the chart, a number for minutes, or D, W or M.
- Zones 1 Show Last
- How many of the newest periods keep their zones drawn; 0 hides this set.
- Zones 1 PDHL
- Draw the previous period's high and low as lines.
- Zones 1 Pivot
- Draw the midpoint of the previous period's range.
- Zones 1 SR1
- Draw the 0.236 levels with their buffer boxes and the box around the pivot.
- Zones 1 SR2
- Draw the 0.786 levels with their buffer boxes.
- Zones 1 SR3
- Draw the 1.618 levels as lines only.
- Zones 1 SR4
- Draw the 2.618 levels with their buffer boxes.
- Zones 1 SR5
- Draw the 4.236 levels as lines only.
- Zones 1 SR6
- Draw the 6.618 levels with their buffer boxes.
- Zones 1 Line Style
- Solid, dashed or dotted lines for the first set of zones.
- Zones 2 Timeframe
- The higher timeframe of the second set of zones, weekly by default.
- Zones 2 Show Last
- How many periods of the second set to keep; 0, the default, hides it.
- Zones 2 PDHL
- Draw the previous high and low lines for the second set.
- Zones 2 Pivot
- Draw the pivot line for the second set.
- Zones 2 SR1
- Draw the 0.236 levels and boxes for the second set.
- Zones 2 SR2
- Draw the 0.786 levels and boxes for the second set.
- Zones 2 Line Style
- Solid, dashed or dotted lines for the second set.
- Zones 3 Timeframe
- The higher timeframe of the third set of zones, monthly by default.
- Zones 3 Show Last
- How many periods of the third set to keep; 0, the default, hides it.
- Zones 3 PDHL
- Draw the previous high and low lines for the third set.
- Zones 3 Pivot
- Draw the pivot line for the third set.
- Zones 3 SR1
- Draw the 0.236 levels and boxes for the third set.
- Zones 3 SR2
- Draw the 0.786 levels and boxes for the third set.
- Zones 3 Line Style
- Solid, dashed or dotted lines for the third set.
- Box Transparency
- Transparency of every zone box, from 0 (solid) to 100 (invisible); the level boxes inside SR1 are ten points lighter.
- Show MA 1
- Draw the first moving average.
- MA 1 Length
- Bars, or higher timeframe bars, in the first average.
- MA 1 Type
- EMA, seeded with a simple average, or SMA for the first average.
- MA 1 Source
- The price series the first average is computed from.
- MA 1 Timeframe
- Blank computes the first average on the chart's bars; a timeframe code computes it on folded higher timeframe bars.
- Show MA 2
- Draw the second moving average.
- MA 2 Length
- Bars, or higher timeframe bars, in the second average.
- MA 2 Type
- EMA, seeded with a simple average, or SMA for the second average.
- MA 2 Source
- The price series the second average is computed from.
- MA 2 Timeframe
- Blank computes the second average on the chart's bars; a timeframe code computes it on folded higher timeframe bars.
- Label: Length
- Write each shown average's length on a plate beside the newest bar.
- Label: Type
- Write each shown average's type on that plate.
- Label: Timeframe
- Write each shown average's timeframe on that plate.
- Show VWAP
- Draw the anchored volume weighted average price.
- vwapAnchor
- Restart the VWAP at the start of each day, week or month.
- Source
- The price series the VWAP weights by volume, hlc3 by default.
- Show Supertrend
- Draw the Supertrend line, green while it trails below price and red while it sits above.
- ATR Length
- Bars in the average true range that sets the Supertrend's distance.
- Factor
- How many average true ranges the Supertrend bands sit from the bar's midpoint.
Frequently asked questions
Why do the zones not move during the day?
Every level is measured from the previous period's high and low, which are final once the new period opens. The study draws them on the period's first bar and only extends them to the right after that.
Why are there three boxes around the pivot?
With SR1 on, one wide box spans from just above R1 to just below S1, the area around the pivot. The two boxes inside it are the buffers around R1 and S1 themselves, drawn ten transparency points fainter and captioned with the level's price and the timeframe code.
Why are SR3 and SR5 drawn without boxes?
The study draws buffer boxes for SR1, SR2, SR4 and SR6 only. SR3 and SR5 are plain lines in the colours of their neighbours, so turning them on adds two lines per period and no boxes.
How does a higher timeframe moving average avoid looking ahead?
The chart's bars are folded into higher timeframe bars, and every chart bar inside a period reads the average as it stood when the previous period closed. The value changes only when a new period opens.