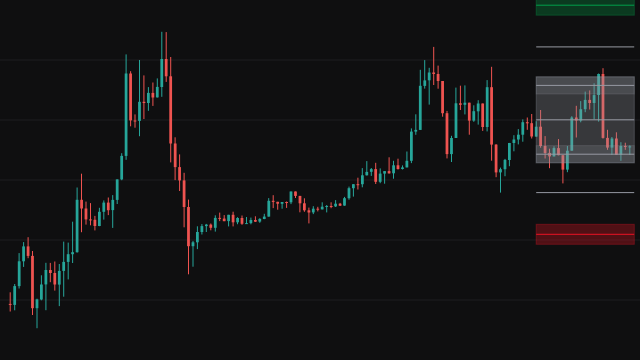
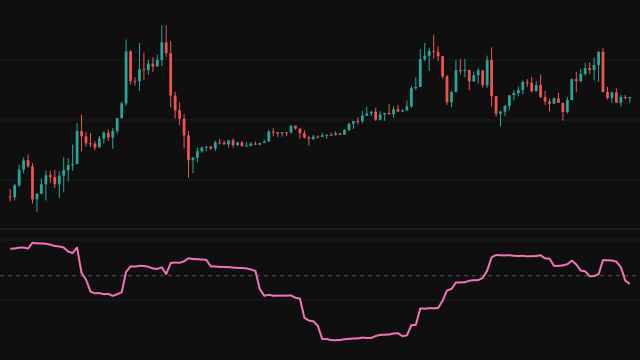
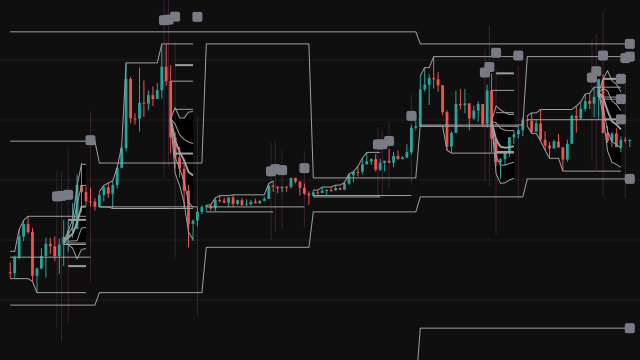
Smart Money Radar draws several price-structure tools on one chart. Order blocks come from a break of structure: when the close crosses above the last confirmed swing high (a pivot with Pivot Length bars on each side), the study walks back up to 50 bars for the last bearish candle and marks its high-to-low range as a bullish block. A close below the last swing low marks the last bullish candle as a bearish block. A block is removed, or kept faded, the first time a later bar trades into its range, and it is dropped once it is older than the maximum age.
Fair value gaps are three-bar gaps: bullish when the low of the newest bar of the three is above the high of the oldest, bearish in the mirror case. The box is anchored on the middle bar, stops extending once price trades into it, disappears when price crosses it completely, and, with Fade With Age on, grows more transparent as it ages. Equal highs and equal lows compare each new swing point with the five before it; a match within the tolerance, and inside the lookback, draws a dashed liquidity line that is marked as swept when price trades through it and removed five bars later.
The study also plots the previous completed day, week (Monday to Sunday) and month high and low, built from the chart's own bars in UTC, and boxes the Asia (00:00 to 08:00), London (07:00 to 16:00) and New York (12:00 to 21:00) UTC session ranges, keeping the last ten of each with dotted rays at the last five highs and lows. Finally, a longer structure pivot drives the BOS and CHoCH labels: a close through the last structure pivot is a break of structure when it agrees with the current direction, and a change of character when it reverses it.
How to read Smart Money Radar
Read the boxes as zones where price may react. A fresh order block or an untouched fair value gap ahead of price marks an area where price moved away quickly, and some traders watch it for a pause or a reversal; once price trades into it, the zone counts as used and is removed or faded. Equal highs and equal lows are two swing points at nearly the same price, often read as a place where stop orders gather, so a swept label shows a level that price has just traded through by more than the tolerance. The day, week and month lines and the session boxes add the prior period and session extremes as reference prices.
BOS labels in one colour show the trend continuing; a CHoCH label shows the first close through the opposite swing and is often read as an early sign of a turn. Every pivot is confirmed only after its right-hand bars have closed, so labels and zones appear a few bars after the swing that created them. None of these marks predicts direction on its own: treat them as a map of recent structure, not as entry signals.
Settings
- Order Blocks
- Draw order blocks after each break of the last confirmed swing high or low.
- Pivot Length (BOS validation)
- Bars on each side of a swing point used for order blocks and equal levels. Higher values find fewer, larger swings.
- Max Age (bars)
- An order block older than this many bars, counted from its candle, is removed.
- Keep Mitigated Blocks (faded)
- Keep a block that price has traded into, faded and stopped at that bar, instead of removing it.
- Bullish OB
- Colour of bullish order blocks.
- Bearish OB
- Colour of bearish order blocks.
- Border Width
- Border thickness of the order blocks; 0 hides the border.
- Fair Value Gaps
- Draw three-bar fair value gaps.
- Min Size (% of price)
- Ignore gaps smaller than this percentage of the close. 0 keeps every gap.
- FVG Max Age (bars)
- A gap older than this many bars is removed; it also sets how quickly gaps fade.
- Fade With Age
- Make each gap more transparent as it gets older, so fresh gaps stand out.
- Bullish FVG
- Colour of bullish fair value gaps.
- Bearish FVG
- Colour of bearish fair value gaps.
- Equal Highs / Equal Lows
- Draw equal-high and equal-low liquidity lines and mark them when they are swept.
- Equal Level Tolerance (% of price)
- How close two swing points must be, as a percentage of price, to count as equal. Also the distance price must pass the level by to sweep it.
- Lookback (bars)
- The furthest back, in bars, an earlier swing point may be to pair with a new one.
- Previous Day H/L
- Plot the high and low of the previous completed UTC day.
- Previous Week H/L
- Plot the high and low of the previous completed week, Monday to Sunday in UTC.
- Previous Month H/L
- Plot the high and low of the previous completed calendar month in UTC.
- Equal Level Colour
- Colour of the equal-high and equal-low lines and their labels.
- Sessions
- Draw the session range boxes on intraday charts. Turning it off hides all three sessions.
- Asia (00:00-08:00 UTC)
- Draw the Asia session range, 00:00 to 08:00 UTC.
- London (07:00-16:00 UTC)
- Draw the London session range, 07:00 to 16:00 UTC.
- New York (12:00-21:00 UTC)
- Draw the New York session range, 12:00 to 21:00 UTC.
- Asia
- Colour of the Asia session box and rays.
- London
- Colour of the London session box and rays.
- New York
- Colour of the New York session box and rays.
- Keep H/L Lines After Session
- When a session ends, leave dotted rays at its high and low, keeping the last five of each.
- BOS / CHoCH
- Draw break of structure and change of character lines and labels.
- Structure Pivot Length
- Bars on each side of the structure pivots. Higher values give fewer, more significant breaks.
- BOS
- Colour of break of structure lines and labels.
- CHoCH
- Colour of change of character lines and labels.
- Watermark
- Show a small panel with the study's name in a corner of the chart.
- Watermark Position
- Which corner of the chart the watermark panel sits in.
- Watermark Text Size
- Has no effect in this version: a table cell takes no text size, so the panel always uses the chart's standard table text.
Frequently asked questions
Why do order blocks and labels appear a few bars after the swing?
Every swing point needs its right-hand bars to close before it is confirmed: five bars for the order block pivots and seven for the structure pivots by default. Nothing is drawn until then, so a swing point is never redrawn at a different bar or price once it is confirmed. Zones and equal levels can still be removed later, when price trades into them or they age out.
What is the difference between BOS and CHoCH?
Both are a close through the last confirmed structure pivot. It is labelled BOS when the break is in the same direction as the previous break, and CHoCH when it is the first break in the opposite direction.
Why did an order block vanish?
A block is removed the first time a later bar trades into its range, or when it becomes older than the maximum age. Turn on Keep Mitigated Blocks to keep used blocks on the chart, faded and stopped at the bar that touched them.
Which timezone do the sessions and previous day levels use?
UTC throughout. The sessions are fixed UTC windows and the day, week and month levels are built from UTC calendar boundaries, whatever timezone the chart axis shows. The session boxes are only drawn on intraday charts.