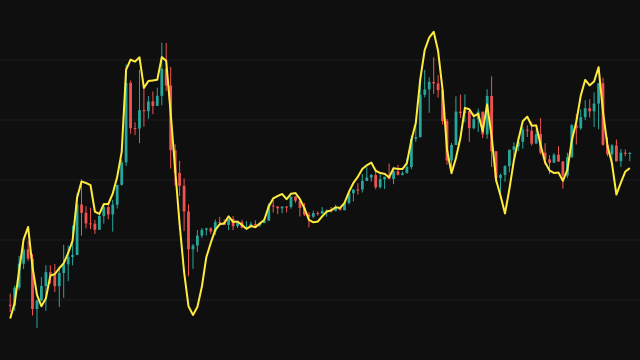
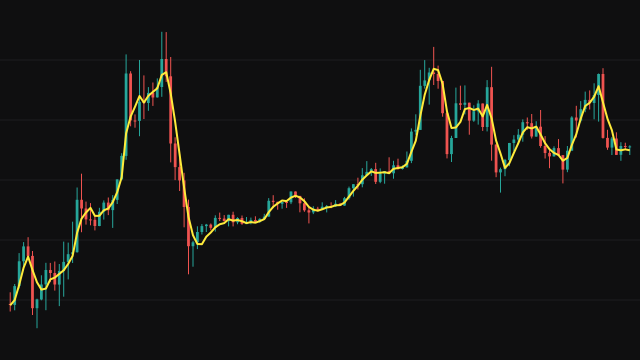
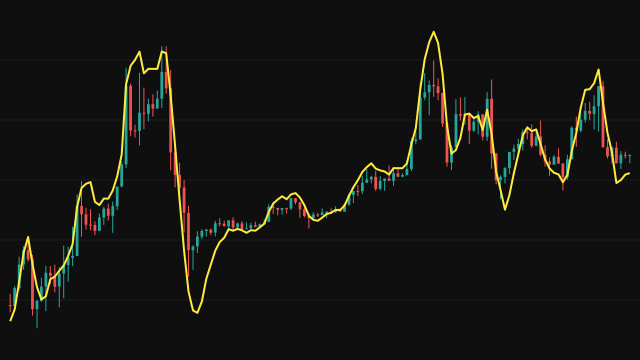
The Guppy Multiple Moving Average, devised by Daryl Guppy, draws twelve exponential moving averages of the close on the price chart in two groups. The short group, 3, 5, 8, 10, 12 and 15 bars, is drawn in blue and stands for the behaviour of short-term traders. The long group, 30, 35, 40, 45, 50 and 60 bars, is drawn in red and stands for longer-term investors.
Each average weights the newest value by 2 / (length + 1) and starts on its first full window, seeded with the simple average of that window, so the longest line appears from the 60th bar. Every length can be changed, and the source can be switched from the close to another price.
How to read Guppy Multiple Moving Average (GMMA)
Read the two groups as bands rather than as twelve separate lines. When the short group sits above the long group and both are fanned out, the uptrend has support from both kinds of trader; the reverse holds for a downtrend. When a group compresses so its lines nearly touch, the traders it represents agree on value, and a compression often comes before a change of direction or a breakout.
A trend change is usually read when the short group crosses through the long group and the long group then starts to widen in the new direction. A short group that dips into a wide, steady long group and turns back is read as a pullback within the trend. Like all moving averages, the bands lag price and give many crossings in a sideways market.
Settings
- Source
- The price series all twelve averages are taken over. Close is the published choice.
- Short Length 1
- Bars in the fastest average of the short group. 3 by default.
- Short Length 2
- Bars in the second average of the short group. 5 by default.
- Short Length 3
- Bars in the third average of the short group. 8 by default.
- Short Length 4
- Bars in the fourth average of the short group. 10 by default.
- Short Length 5
- Bars in the fifth average of the short group. 12 by default.
- Short Length 6
- Bars in the slowest average of the short group. 15 by default.
- Long Length 1
- Bars in the fastest average of the long group. 30 by default.
- Long Length 2
- Bars in the second average of the long group. 35 by default.
- Long Length 3
- Bars in the third average of the long group. 40 by default.
- Long Length 4
- Bars in the fourth average of the long group. 45 by default.
- Long Length 5
- Bars in the fifth average of the long group. 50 by default.
- Long Length 6
- Bars in the slowest average of the long group. 60 by default.
Frequently asked questions
Why twelve averages instead of two?
Two averages give one crossing. Two groups of six show how much agreement there is inside each time frame: the width of each band and the gap between them say more about trend strength than a single crossing does.
What does it mean when the long group compresses?
The longer-term averages have come together, so longer-term participants see value in a narrow range. A trend is weak at that point, and a widening that follows shows which way the new trend is going.
Why do the lines start at different bars?
Each average needs a full window before it has a value, so the 3 bar line starts on the third bar and the 60 bar line on the 60th.