Note. The background shading is meant to cover signal bars among the newest Display Length bars, but a study cannot know in advance which bar will be the newest, so it counts whole chart intervals back from the chart's clock: on a market that closes, or when the clock is well past the newest bar, fewer bars are shaded, and where the chart supplies no clock only the newest bar can be.
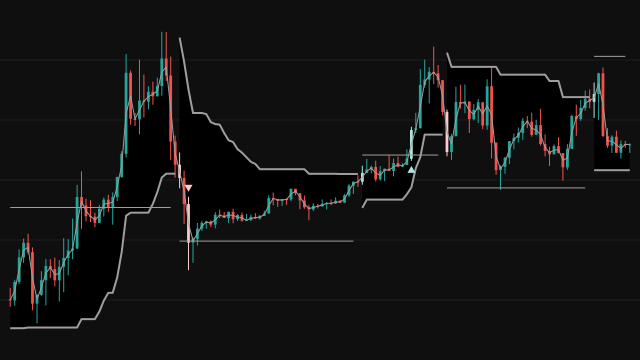
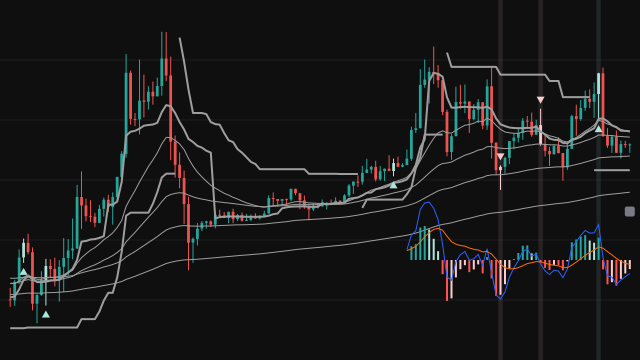
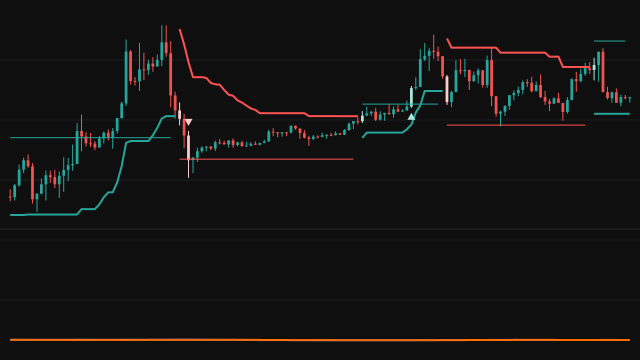
This setup looks for a short, sharp move in the direction several tools already agree on. On the chart it draws four exponential moving averages (20, 50, 100 and 200 by default), a VWAP that restarts at the start of each anchor period (or a TWAP, the plain average of ohlc4 since the anchor, for symbols without volume), and a Supertrend line that is green while the trend is up and red while it is down.
A long signal needs every one of these at once: the close above the Supertrend and above the VWAP, the Stochastic %K above the Over Sold level and above its %D, and a fast MACD (3, 9, 15 by default) that is positive and above both its signal line and its histogram. A short signal is the mirror image. In Continuous mode the signal is armed only after the MACD has been on the other side of zero, so it fires on the first bar that completes the setup after a pullback, then re-arms. In Flip mode a signal appears only on the bar where the qualifying side changes from long to short or back.
Optional filters can drop signal bars that are too small against the ATR, have too small a body, are not larger than the previous bar, or carry too little volume or relative volume, and a time filter keeps only bars inside a clock window. On the newest bar the study also draws small Stochastic, MACD and volume panels over the price pane, scaled into bands below and above the recent price range.
How to read Option Buying Scalping Setup
A pale red triangle above a bar and a pale red candle mark a short setup; a pale green triangle below a bar and a pale green candle mark a long one. Signal bars near the right edge also get a faint shade in the same colour, while the candle colour and the triangles cover the whole chart. Read a long signal as a pullback that has turned back in the direction the Supertrend, the VWAP, the Stochastic and the MACD all agree on. The four averages are drawn for context only and play no part in the signal.
The miniature panels are a quick glance at momentum and participation without opening extra panes: the Stochastic with its three levels at the bottom, the MACD with a coloured histogram below the price range, and volume bars with their average above it. They are redrawn on every new bar and are not a separate oscillator scale. The setup has many conditions, so it fires rarely on quiet charts and can lag a fast reversal. It describes past bars and does not predict the next one.
Settings
- Screening Method
- Continuous fires after each pullback while the setup holds; Flip fires only on the bar where the qualifying side changes.
- ATR Length
- The number of bars in the average true range behind the Supertrend bands.
- Factor
- How many average true ranges the Supertrend bands sit from the bar's midpoint. Larger values flip the trend less often.
- Display EMA
- Show or hide the four exponential moving averages. The signals do not use them.
- Length 1
- The length of the first and fastest exponential moving average.
- Length 2
- The length of the second exponential moving average.
- Length 3
- The length of the third exponential moving average.
- Length 4
- The length of the fourth and slowest exponential moving average.
- Display VWAP / TWAP
- Show or hide the VWAP or TWAP line. The signals still use it when hidden.
- Choose
- VWAP weights the typical price by volume; TWAP averages
ohlc4equally and suits symbols without volume. - Timeframe
- The period the VWAP or TWAP restarts on: 1D, 1W, 1M, 3M, 12M, a number of minutes such as 60, or seconds such as 30S.
- Display MACD
- Show or hide the miniature MACD panel. The signals still use the MACD.
- Fast Length
- The length of the fast exponential average in the MACD line.
- Slow Length
- The length of the slow exponential average in the MACD line.
- Signal Smoothing
- The length of the exponential average of the MACD line that forms its signal line.
- MACD Vertical Offset
- How far below the recent price range the MACD panel sits, as a multiple of that range.
- MACD Height
- How tall the MACD panel is drawn, as a multiple of the recent price range.
- Display Stochastic
- Show or hide the miniature Stochastic panel. The signals still use the Stochastic.
- %K Length
- The number of bars whose high and low range the close is measured within.
- %K Smoothing
- The length of the simple average that smooths the raw %K.
- %D Smoothing
- The length of the simple average of %K that forms %D.
- Over Bought
- A short signal needs %K below this level, so a higher value allows shorts from stronger readings.
- Over Sold
- A long signal needs %K above this level, so a lower value allows longs from weaker readings.
- Stochastic Vertical Offset
- How far below the recent price range the Stochastic panel sits, as a multiple of that range.
- Stochastic Height
- How tall the Stochastic panel is drawn, as a multiple of the recent price range.
- Display Volume MA
- Show or hide the average volume line in the volume panel.
- Type
- Regular colours each volume bar by the candle; Buying/Selling splits it into a selling and a buying share; None hides the panel.
- Volume Vertical Offset
- How far above the recent price range the volume panel sits, as a multiple of that range.
- Volume Height
- How tall the volume panel is drawn, as a multiple of the recent price range.
- Apply ATR Filter
- Keep a signal only when the bar's range is larger than the ATR times the multiplier.
- Filter ATR Length
- The number of bars in the average true range the ATR filter compares against.
- ATR Multiplier
- How many ATRs the signal bar's range must exceed when the ATR filter is on.
- Apply Body % Filter
- Keep a signal only when the candle body covers at least the given share of the bar's range.
- Body % Above
- The body share, in percent, used by the body filter and by the body size filter.
- Apply Body Size Filter
- Keep a signal only when the body share is met and the bar's range is at least the multiplier times the previous bar's.
- Body Size Multiplier (x)
- How many times the previous bar's range the signal bar must reach when the body size filter is on.
- Apply Volume Filter
- Keep a signal only when the bar's volume is above its simple average.
- Volume SMA Length
- The length of the volume average used by the volume filter and drawn in the volume panel.
- Apply Relative Volume Filter
- Keep a signal only when relative volume is above its own average times the multiplier.
- Relative Volume Length
- The length of the volume average relative volume is measured against, and of the average of relative volume.
- Rel Vol SMA Multiplier
- How many times its own average relative volume must reach when that filter is on.
- Apply Time Filter
- Keep a signal only on bars that open inside the clock window, read in the chart's timezone.
- Time From (hour)
- The hour the signal window opens.
- Time From (minute)
- The minute the signal window opens.
- Time To (hour)
- The hour the signal window closes; a bar opening exactly at the closing time is excluded.
- Time To (minute)
- The minute the signal window closes.
- Display Length
- How many recent bars the miniature panels cover, and how many chart intervals back from the chart's clock the signal shading reaches.
Frequently asked questions
Why does a signal sometimes not appear even though the trend looks clear?
In Continuous mode the MACD first has to be on the other side of zero to arm the setup. A trend that never pulls back far enough for that does not fire again until it does.
What is the difference between Continuous and Flip?
Continuous marks every completed pullback setup while the side holds, so it can mark several bars in one trend. Flip marks only the bar where the qualifying side changes, and the very first side the chart ever takes is not marked because there is nothing before it to change from.
Why are the MACD and Stochastic drawn over the price chart?
They are compact panels scaled into bands just below the recent price range, with volume above it, so momentum and participation can be read without extra panes. Only their shape matters, not the price level they sit at.
Should I use VWAP or TWAP?
Use VWAP when the symbol has volume. A missing volume leaves VWAP blank until the next anchor, and then no signal can fire, so choose TWAP for an index or any symbol without volume.