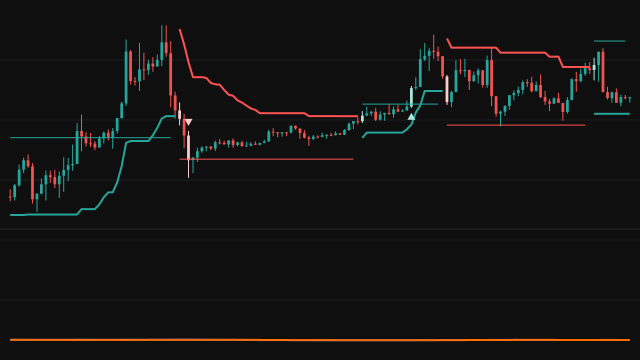
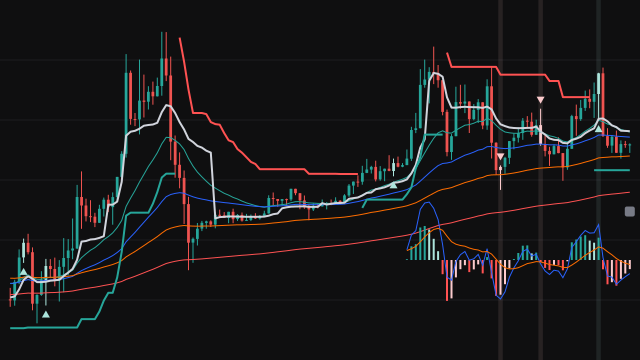
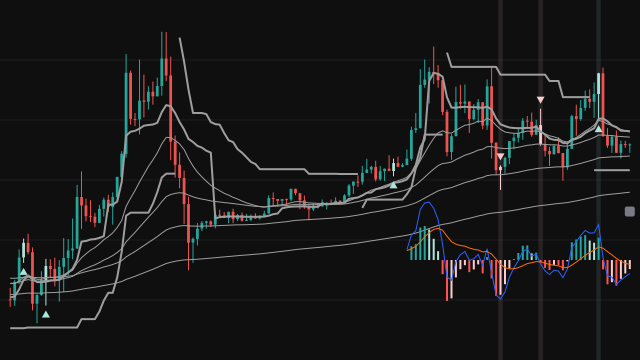
This setup is built to skip the sideways drift that often follows a Supertrend flip. A Supertrend line (an ATR band around the bar's midpoint that only tightens while the trend holds) is drawn in green below price in an uptrend and in red above price in a downtrend, with the area between it and the candle body shaded. When the close crosses the Supertrend, the setup is armed and a volatility range is projected from the crossing close: by default 1.5 times the range ATR above the close after an upward cross, or below it after a downward cross. Type Points replaces the ATR distance with a fixed number of points.
The range ATR is the chosen average (RMA, SMA, EMA or WMA) of the true range, and it is compared with its own simple average. A long signal fires on the first bullish candle that closes above the top of the range while this ATR is above its average, and a short signal on the first bearish candle that closes below the bottom of the range under the same condition. Each armed setup fires at most once, and the next cross arms a new one.
Optional filters can make the signal candle meet more conditions: a minimum bar range against a separate ATR (on by default), a minimum body share of the candle, a candle larger than the previous one, volume above its average, relative volume above its own average, a cumulative daily price change, a cumulative daily volume change against the previous day, and a time window. The table on the newest bar shows the day's cumulative percentage change, the change in cumulative volume against the previous day, and both days' cumulative volume in lakhs (units of 100,000).
How to read Sideways Market Skipper Scanner
A candle painted light green or light red marks a Supertrend cross, the bar that arms the setup. The green step line above price (or the red one below it) is the range the market has to clear; the signal is not taken while price stays inside it. A small triangle below a light green candle is a long signal and a triangle above a light red candle is a short one. The ATR and its average are drawn on the left scale: a signal only appears while the ATR line is above its average, which means volatility is expanding.
The cross and the signal are only taken on a closed bar, so neither appears and then vanishes on a forming bar. The signal comes after the cross and after the range break, so it gives up the early part of a move in exchange for skipping many flips that go nowhere. When no candle leaves the range before the next cross, the setup simply produces no signal. The cumulative daily figures restart at midnight in the chart's timezone, and the first day on the chart has no volume figures because the running total only starts at the first change of day.
Settings
- ATR Length
- The number of bars in the ATR behind the Supertrend band. A longer length makes the band steadier and the crosses rarer.
- Factor
- How many ATRs the Supertrend band sits from the bar's midpoint. A larger factor gives fewer, later crosses.
- Display
- Draw the top and bottom of the volatility range. The signal logic runs either way.
- Range Type
- Auto ATR sets the range distance from the range ATR times its multiplier, so it rescales with the instrument. Type Points uses the fixed distance below.
- Type Points
- The fixed range distance in price points, used only when Range Type is Type Points.
- Range ATR Length
- The number of bars in the average of the true range that sets the range distance and the volatility test.
- ATR Smoothing
- The average applied to the true range: RMA, SMA, EMA (seeded with the simple mean of its first window) or WMA.
- ATR Multiplier
- How many range ATRs the range extends beyond the crossing close in Auto ATR mode. A larger multiplier asks for a bigger break.
- ATR SMA Length
- The length of the simple average of the range ATR. A signal needs the ATR above this average.
- Display ATR and ATR SMA
- Draw the range ATR and its average on the left scale.
- Apply % Change Filter
- Require the day's cumulative percentage change to be above the threshold for a long signal and below its negative for a short one.
- % Change Above/Below +/-
- The cumulative daily percentage change the price change filter asks for.
- Apply Volume % Change Filter
- Require the day's cumulative volume to be up on the previous day's total by at least the threshold.
- Volume % Change Above
- The minimum percentage change of the day's cumulative volume against the previous day. Zero only asks for no fall.
- Apply ATR Filter
- Require the signal candle's high to low range to be larger than the filter ATR times its multiplier. On by default.
- Filter ATR Length
- The number of bars in the ATR used by the ATR filter.
- Filter ATR Multiplier
- How many filter ATRs the signal candle's range must exceed. A higher value keeps only larger candles.
- Apply Body % Filter
- Require the candle body to cover at least the given share of the candle's range.
- Body % Above
- The minimum body share, in percent, for the body filter and the body size filter.
- Apply Body Size Filter
- Require the candle to pass the body share test and to be at least the given multiple of the previous candle's range.
- Body Size Multiplier (x)
- How many times the previous candle's range the signal candle's range must reach.
- Apply Volume Filter
- Require the signal candle's volume to be above the simple average of volume.
- Volume SMA Length
- The number of bars in the volume average used by the volume filter.
- Apply Relative Volume Filter
- Require relative volume (this bar's volume over the previous bar's volume average) to be above its own average times the multiplier.
- Relative Volume Length
- The length of both the volume average behind relative volume and the average of relative volume itself.
- Rel Vol SMA Multiplier
- How many times its own average the relative volume must reach.
- Apply Time Filter
- Keep signals only on bars that open inside the time window below, read in the chart's timezone.
- Time From (hour)
- The hour the time window opens.
- Time From (minute)
- The minute the time window opens.
- Time To (hour)
- The hour the time window closes. The closing minute itself is outside the window.
- Time To (minute)
- The minute the time window closes.
- Display Table
- Show the readout of the day's cumulative change and volume on the newest bar.
- Position
- Where the readout sits. The left positions use the left corners and the right and center positions use the right corners; bottom positions use the bottom corners and the rest the top.
- Size
- The text size the readout asks for. The grid is drawn at the chart's own text size, so this setting has no effect.
Frequently asked questions
Why did a Supertrend cross not produce a signal?
A cross only arms the setup. The signal needs a candle in the new direction that closes beyond the volatility range while the range ATR is above its average and every enabled filter passes. If price stays inside the range until the next cross, no signal is given for that cross.
Why does a new range line appear one bar after the cross?
A range level is drawn once it has held for a bar, and it is then drawn back to the bar it was set on. On the cross bar itself the level is new, so it appears as soon as the next bar confirms it.
Why are the volume figures in the table missing at first?
The daily volume total only starts at the first change of day on the chart, so on the first day Vol, Vol %Chg and PD Vol all read a dash and the volume % change filter cannot pass. On the second day there is still no complete previous day: PD Vol reads a dash and Vol %Chg compares the day with itself, so it reads 0 %. From the third day every figure is filled. The volume average and relative volume filters do not use these daily totals.
What is the difference between Auto ATR and Type Points?
Auto ATR sets the range distance from the range ATR times its multiplier on the cross bar, so it adapts to how much the instrument is moving. Type Points uses the same fixed number of price points on every cross, which suits an instrument whose typical move you already know.