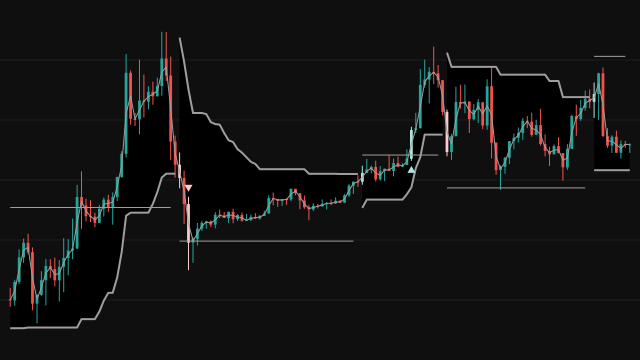
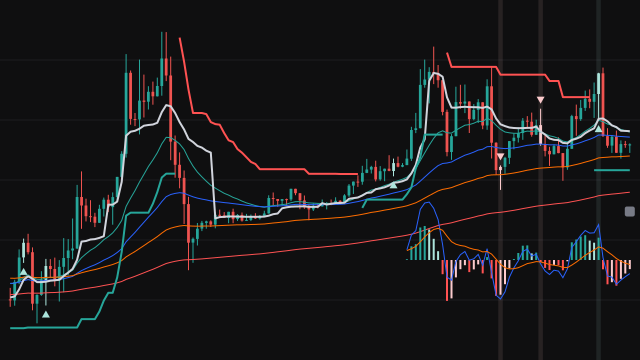
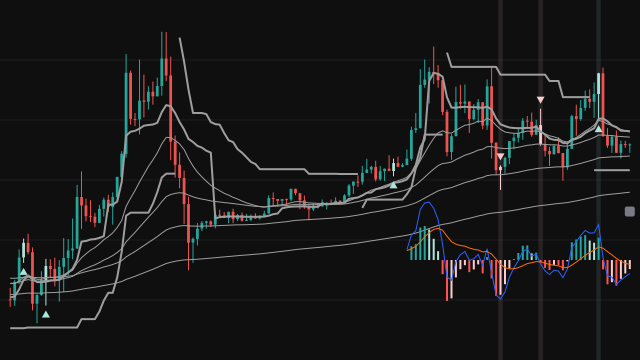
A Supertrend cross can be followed by a stretch of sideways trading. This study adds a second step that waits for price to leave it. When the close crosses the Supertrend line (from the ATR length and factor in the settings), it opens a volatility range: for an upward cross a level above the crossing close, for a downward cross a level below it. The distance is the range ATR times its multiplier, or a fixed number of points with the Type Points option.
The range ATR is the true range smoothed by RMA, SMA, EMA or WMA, and the study plots it in its own pane with its simple average. A long signal needs the close to break above the top of the range on a candle that closes above its open while the range ATR is above its average, so volatility is expanding. A short signal is the mirror image below the bottom of the range. Each cross arms one setup and the first qualifying break fires it.
Optional filters can be added to the break: the day's cumulative percentage change, the day's volume against the previous day's, a candle range wider than the ATR (on by default), a minimum body share, a candle larger than the previous one, volume above its average, relative volume above a multiple of its own average, and a time window. The Supertrend and the range levels are drawn on the price chart, the ATR pair in the study's pane.
How to read Sideways Market Skipper
Candles coloured at a Supertrend cross show where a new range was opened, and the step line beside price is the level the market has to clear. While price stays inside the range the study does nothing, which is the sideways phase it is meant to skip. A green triangle below a candle is a long break and a red triangle above one is a short break, and those candles are coloured too.
In the lower pane, the blue ATR above the orange ATR SMA means ranges are widening, which the break requires. A signal is a description of the bar that broke out, not a forecast: a break can still fail, and on a fast chart many ranges are opened and never broken. The table reads the newest bar: %Chg is the sum of the bar-to-bar percentage changes of the close since the day began, Vol %Chg compares the day's running volume with the previous day's total, and Vol and PD Vol are those two volumes in lakhs.
Settings
- ATR Length
- The number of bars in the ATR that sets the Supertrend's distance from price.
- Factor
- How many ATRs the Supertrend sits from price. Higher values cross less often.
- Display
- Draw the top and bottom range levels on the price chart.
- Range Type
- Auto ATR sets the range width from the range ATR; Type Points uses the fixed number of points below.
- Type Points
- The range width in price points, used only when Range Type is Type Points.
- Range ATR Length
- The number of bars the true range is smoothed over for the range ATR plotted in the pane.
- ATR Smoothing
- How the true range is averaged: RMA, SMA, EMA or WMA.
- ATR Multiplier
- How many range ATRs the range level sits from the crossing close in Auto ATR mode.
- ATR SMA Length
- The length of the simple average of the range ATR; a break needs the ATR above it.
- Apply % Change Filter
- Require the day's cumulative percentage change to be above the figure for a long and below its negative for a short.
- % Change Above/Below +/-
- The day's percentage change the filter above requires.
- Apply Volume % Change Filter
- Require today's cumulative volume to beat the previous day's by at least the percentage below.
- Volume % Change Above
- The volume increase over the previous day the filter above requires, in percent.
- Apply ATR Filter
- Require the breakout candle's high-low range to exceed the filter ATR times its multiplier.
- Filter ATR Length
- The number of bars in the ATR the candle filter compares against.
- Filter ATR Multiplier
- How many filter ATRs the breakout candle's range must exceed.
- Apply Body % Filter
- Require the candle's body to cover at least the share of its range set below.
- Body % Above
- The body share, in percent of the candle's range, used by both body filters.
- Apply Body Size Filter
- Require a strong body and a range at least the multiplier times the previous candle's range.
- Body Size Multiplier (x)
- How many times the previous candle's range the breakout candle must span, as a whole number.
- Apply Volume Filter
- Require the candle's volume to be above its simple average.
- Volume SMA Length
- The number of bars in the volume average the volume filter uses.
- Apply Relative Volume Filter
- Require relative volume, this bar's volume over the previous bar's average, to beat a multiple of its own average.
- Relative Volume Length
- The number of bars in both averages behind relative volume.
- Rel Vol SMA Multiplier
- How many times its own average relative volume must reach.
- Apply Time Filter
- Allow signals only between the from and to times of each day, on the chart's clock.
- Time From (hour)
- The hour the signal window opens.
- Time From (minute)
- The minute the signal window opens.
- Time To (hour)
- The hour the signal window closes; a bar at that exact time is outside it.
- Time To (minute)
- The minute the signal window closes.
- Display Table
- Show the table of the day's percentage change and volume.
- Position
- Where the table sits; each position is drawn in its nearest corner of the chart.
- Size
- Text size of the table. Tables in this version draw at the chart's own text size, so this has no visible effect.
Frequently asked questions
Why are some Supertrend crosses not followed by a signal?
A cross only arms the setup. The signal needs a later close beyond the range level on a candle in the same direction, with the range ATR above its average and every switched-on filter passing. If price stays inside the range, or the opposite cross comes first, there is no signal.
Where does a range line start and stop?
The level is fixed on the crossing bar and drawn only on bars where it is unchanged from the bar before, shifted one bar back. So the step starts on the crossing bar, and the last bar before the next cross is left blank, which leaves a one-bar gap between two ranges.
Should I use Auto ATR or Type Points?
Auto ATR follows the instrument's own volatility, so the same settings scale to any symbol and timeframe. Type Points is a fixed distance and only makes sense once you know what a typical move is for the one instrument you trade.
Why can Vol or PD Vol read n/a?
The day's volume is a running total that starts on the first new day the chart reaches, so the partial day the chart opens on has none. On that first full day PD Vol is n/a, because the day before it had no total, and Vol %Chg reads 0.00 %. From the second full day on, both volumes are filled.