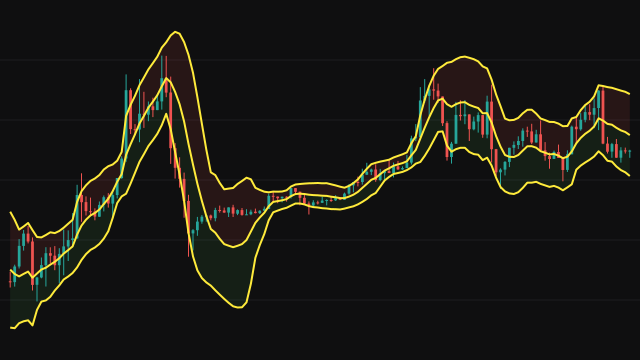
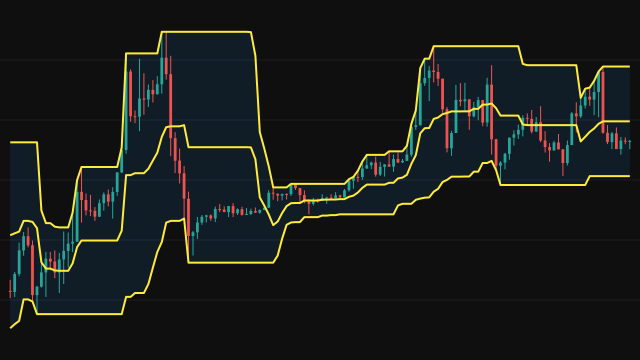
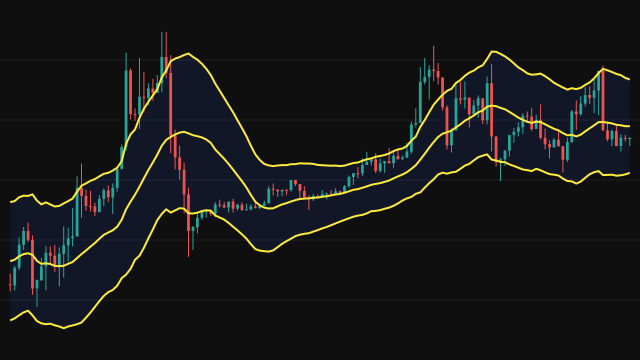
Regression Channels fits a straight line through the last Period values of the source by least squares, the line that keeps the squared vertical distances to the prices as small as possible. The regression line on each bar is where that fitted line ends, on the current bar.
The bands measure how closely prices hug the fit. The study takes each price in the window, subtracts the fitted line's value at that bar, squares the result, averages the squares over the window and takes the square root. That root mean square residual, times the multiplier, sets the distance of the upper and lower bands from the regression line. The upper half of the channel is shaded red and the lower half green.
The line needs a full window, so it starts on bar Period - 1.
How to read Regression Channels (REGCHANNEL)
The regression line tracks the trend of the window rather than a flat average, so in a steady move it sits close to price with little lag. The bands widen when prices scatter around the trend and narrow when they follow it closely. A close outside a band is a move that is unusual for the current trend; inside a clean trend, price returning toward the line after touching a band is the common pattern.
Each value is the end of a fresh fit, so a new bar can change the slope noticeably on a short period. Past values never change, but the newest point reacts sharply to large bars near the end of the window.
Settings
- Period
- How many bars the line is fitted through. A longer period gives a steadier trend line and wider bands.
- Source
- The price series the line is fitted to.
- Standard Deviation Multiplier
- Band distance as a multiple of the root mean square residual of the fit. A larger value widens the channel.
Frequently asked questions
How is the band width calculated?
From the residuals of the fit: each price minus the fitted line at that bar, squared, averaged over the window and square rooted. The sum is divided by Period, not Period - 1.
Why does the line react to a single large bar?
The newest bar sits at the end of the fit, where it has the most leverage on the slope. A big bar can tilt the whole line and move its end point.
Why is there nothing on the first bars?
A fit needs a full window of Period values, so the first line appears on bar Period - 1.