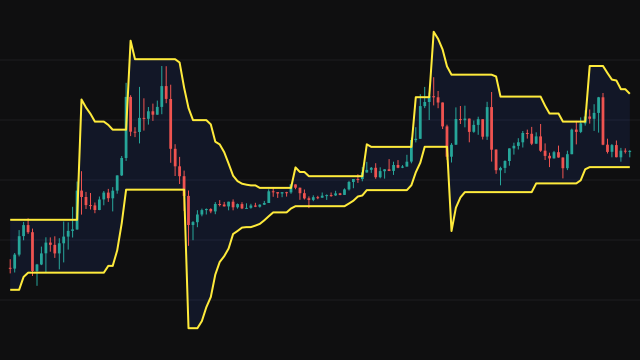
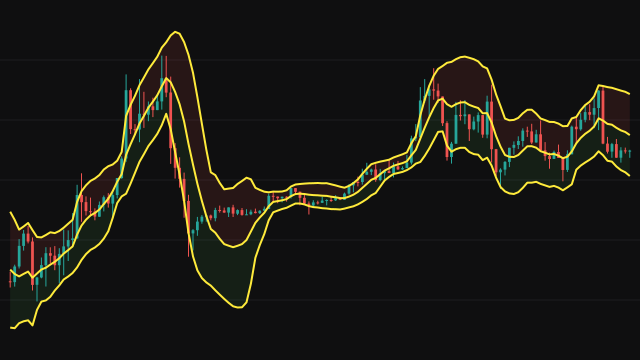
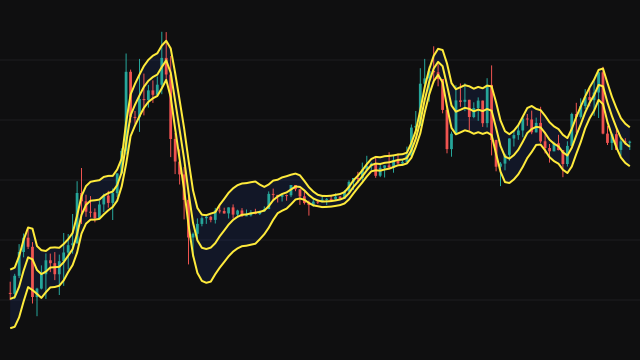
This channel combines a simple moving average with an average true range. The middle line is the simple mean of the source over the last Length bars, and until Length bars exist it is the mean of every bar so far, so the line starts on the first bar.
The width comes from true range: the largest of the bar's high minus low, the high minus the previous close, and the previous close minus the low. On the first bar the previous close is that bar's own close. True range is smoothed recursively, each bar keeping (Length - 1) / Length of the previous average and adding 1 / Length of the new true range. The average starts from zero, and the share of the starting weight that has not yet decayed is divided back out, so the average is unbiased from the first bar. The upper and lower bands sit that average true range, times the multiplier, above and below the middle line.
How to read Stoller Average Range Channel (STARCHANNEL)
Because the width follows true range rather than closing-price variance, the channel widens when bars get larger or gap and narrows in quiet trading. A close beyond a band is a move of more than the chosen number of average ranges from the mean. In a range the bands mark stretched prices; in a trend price can travel along one band, and the middle line acts as the level that marks a loss of momentum.
The width is measured in price units, so a multiplier that suits one timeframe may be too tight or too loose on another.
Settings
- Source
- The price series the middle line averages.
- Length
- How many bars both the middle line and the average true range cover. A longer length gives a smoother channel.
- ATR Multiplier
- Half-width of the channel as a multiple of the average true range. A larger value widens the bands.
Frequently asked questions
Why use true range instead of standard deviation?
True range measures how far each bar actually travels, including gaps from the previous close. A channel built from it reacts to bigger bars even when closes barely change.
Why are there values from the very first bar?
The middle line averages however many bars exist, and the average true range divides out the weight of the history it has not seen yet, so neither needs a warmup.
What is a typical multiplier?
The default is 2. Smaller values hug price and are touched often; larger values are touched only on unusually large moves.