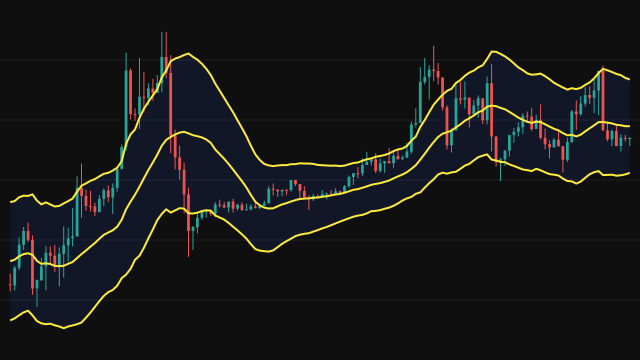
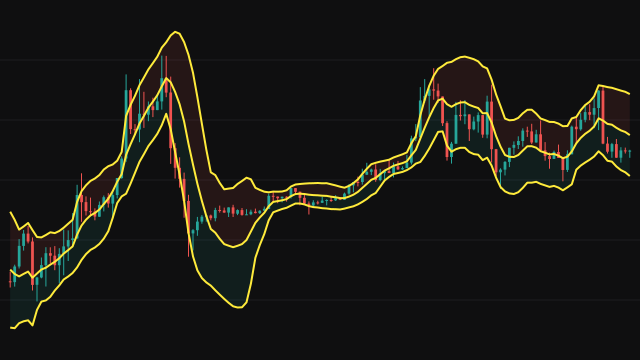
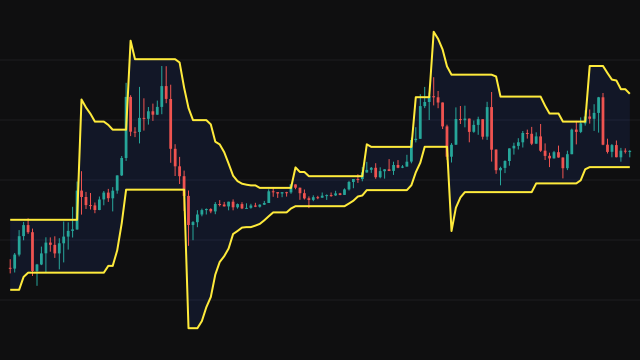
Standard Deviation Channel fits a straight trend line through the last Period values of the source by least squares and plots the value of that line on the current bar as the regression line. It then measures how far the prices in the window sit from the fitted line: each residual is squared, the squares are averaged over the window and the square root is taken.
That standard deviation of the residuals, times the multiplier, is added to and subtracted from the regression line to give the upper and lower channel. The area above the line is shaded red and the area below it green. The residual sum is divided by Period rather than Period - 1, and the line starts once a full window exists, on bar Period - 1.
How to read Standard Deviation Channel (SDCHANNEL)
The middle line follows the slope of the recent trend, and the channel shows how far price usually strays from it. In an orderly trend the channel is narrow and price tends to return toward the line after touching an edge. A close well outside the channel is unusual for the current fit and often comes as the trend changes pace or direction.
The channel is recomputed from a fresh fit on every bar, so on a short period its slope can swing quickly. Pair it with a longer period to judge the main trend.
Settings
- Period
- How many bars the line is fitted through. A longer period gives a smoother line and a wider channel.
- Source
- The price series the channel is fitted to.
- Standard Deviation Multiplier
- Channel distance as a multiple of the standard deviation of the regression residuals. A larger value widens the channel.
Frequently asked questions
Is this the standard deviation of price?
No. It is the standard deviation of the distances between each price and the fitted trend line, so a clean trend gives a narrow channel even when price has moved a long way.
How does it differ from standard deviation bands around a moving average?
Those bands sit around a moving average, which lags behind a trend. This channel sits around a sloped regression line, so in a trend it lags less and its width reflects scatter around the trend, not the trend itself.
When does the channel first appear?
On bar Period - 1, the first bar with a full window to fit.