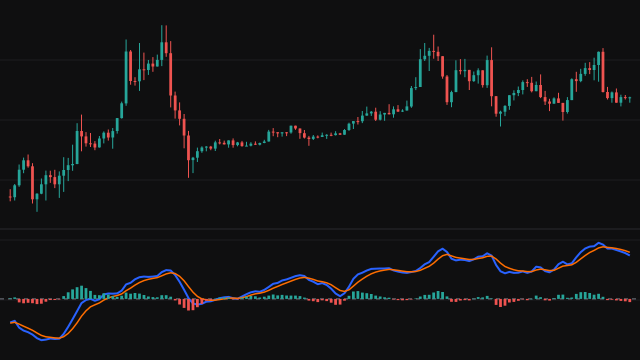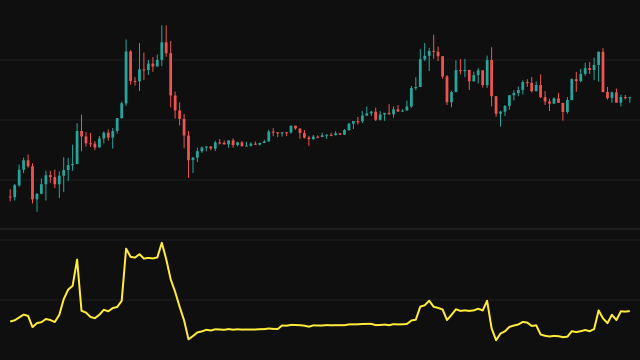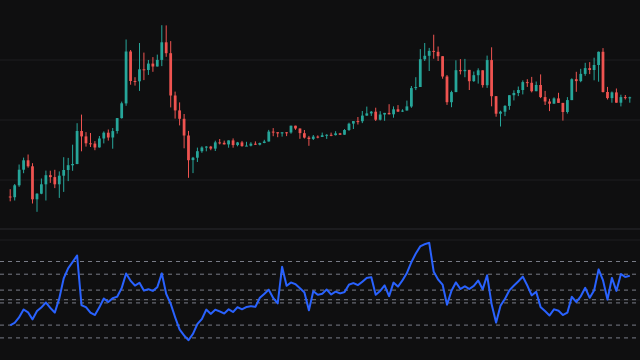
Note. This version differs from the author's script in these ways: the relative strength reading against a benchmark index is left out of the status table, because the library's chart carries one instrument and that reading needs a second; Black Background is on and the symbol format off by default; the Show switches also hide the symbol plates, and the DS mark follows Show Ease of Movement rather than the two bar reversal switch; a symbol is a small plate carrying the sign's code rather than a triangle, because a drawn label has no triangle shape; the trend and strength bands are rows of squares above and below the bars rather than along the chart's top and bottom edges; the support, resistance and high volume lines are drawn as lines with dots, because a plot has no cross or circle style; four line colours are lighter or changed so that each shows on a dark chart and no two unrelated lines share one; and the alert log shows at most 20 messages.
Volume Price Analysis reads every bar three ways: its spread (high minus low) against the 40 bar average spread, where it closed within that spread (from a down close in the lowest fifth to an up close in the highest), and its volume against the 60 bar average volume. Combinations of those readings name the signs the method looks for: an upthrust (a wide bar that pushes to a new high and closes near its low), no demand and no supply bars (narrow bars on volume below the last two bars), tests of supply, stopping volume, effort to rise or fall and whether that effort failed, buying and selling climaxes, two bar reversals, and high volume that could not move the price. This is version 5.0 of the study.
Three trend readings decide which of those signs count. Each measures how far the high has travelled above an earlier low, and the low below an earlier high, in units of the average true range scaled by the square root of the span (the random walk index). The major trend compares the two over 8 and 40 bars, the mid trend reads 2 and 10 bars, and the minor trend reads the 8 and 40 bar travel on each side. A reading above 1 is a trend; many signals only count in one direction of it.
The status table in the top right corner describes the newest bar: its close, volume and spread class, the three trends, an absolute strength reading (a weighted four bar RSI against bands drawn from its own 30 bar range) and money flow (a money flow index against its 22 bar weighted average). The alert log in the bottom left lists the newest messages, coloured green for strength, red for weakness and yellow for a warning. Candles are coloured green when the close is above the previous close and red otherwise, in a lighter shade when volume is below its 60 bar average. Optional lines add 50 and 200 bar EMAs, three EMAs of the close or the typical price, a VWAP that restarts each day, support and resistance at the latest new highs and lows, and the range of the latest high volume bars.
How to read Volume Price Analysis (VPA)
Marks above the bars are signs of weakness: UT, TRB, TC, PUT and PUC, ND, EUF, ED, SCE and BC. Marks below the bars are signs of strength: NS, LVT, ST, SV, EU, EDF, BCE and SC. TB marks a two bar reversal on either side, and DS a bar whose high volume could not move the price, which may be an area of supply or demand. With the symbol format switched on, each sign is a small plate carrying its code, and pointing at it shows a description.
Read a sign in its setting rather than on its own. A sign of strength after a fall, on high volume, near a recent low and with the trend readings turning up carries more weight than one in the middle of a range. The table gives the newest bar's reading at a glance, and the log keeps the last few messages. Each sign is read from the whole bar, so on a bar that is still forming it can appear and go again before the close. The averages count bars, not days: the 60 bar volume average covers about three months of daily bars but only a week or two of hourly bars on a stock.
Settings
- New Chart format with symbols and POP up descriptions
- Draw each sign as a small plate with its code and a description shown on hover, instead of a text mark.
- Black Background
- Paint the chart background black. Switched off, it is painted white.
- Show Trend Bands
- Draw three rows of squares above the bars for the major, mid and minor trend: green up, red down, yellow no trend.
- Show Strength Bands
- Draw a row of squares below the bars from the absolute strength reading: lime strong, orange weak, blue neutral.
- Plot 50 EMA
- Draw the 50 bar exponential moving average of the close.
- Plot 200 EMA
- Draw the 200 bar exponential moving average of the close.
- Show VWAP
- Draw the volume weighted average price of the typical price, restarted on the first bar of each day.
- Show EMA
- Draw the short, mid and long EMAs below, with a shaded band between each pair.
- EMA Source
- The price those three EMAs follow: CLOSE, or PIVOT for the typical price (high, low and close averaged).
- Short EMA period
- Bars in the short EMA.
- Mid EMA period
- Bars in the mid EMA.
- Long EMA period
- Bars in the long EMA.
- Show Up Thrusts (UT)
- Mark upthrusts (UT1) and the down bars that confirm them (UT2).
- Show Top Reversal Bar (TRB)
- Mark a wide down bar closing low at a new 10 bar high, after a wide up bar on above average volume, in a major up trend.
- Show Trend Change (TC)
- Mark a down bar at a new 5 bar high, after an up bar, on above average volume in an up trend.
- Show Pseudo Up Thrust (PST/PUC)
- Mark pseudo upthrusts (PUT) and the down bars closing low that confirm them (PUC).
- Show No Demand (ND)
- Mark narrow up bars closing in their upper half on volume below the last two bars and below average.
- Show No Supply (NS)
- Mark narrow down bars closing mid range on volume below the last two bars and below average.
- Show Low Volume Supply Test (LVT/ST)
- Mark low volume tests of supply at a 5 bar low (LVT) and the up bars that confirm them (ST).
- Show Strength Signals (ST)
- Mark strength returning after a fall: an up bar closing high on above average volume after a down bar, while the trend readings point down.
- Show Stop Volume (SV)
- Mark stopping volume: a bar at a 5 bar low on volume above 1.5 times average that closes mid range or higher in a major down trend.
- Show Effort Up (EU)
- Mark effort to rise: a higher high, higher low and higher close near the top of a wider than average bar on above average volume.
- Show Effort Up Fail (EUF)
- Mark the bar after an effort to rise when it is an upthrust, confirms one, or is a down bar wider than average.
- Show Effort Down (ED)
- Mark effort to fall: a lower high, lower low and lower close near the bottom of a wide bar on rising volume.
- Show Effort Down Fail (EDF)
- Mark the bar after an effort to fall when it is an up bar wider than average or a sign of strength.
- Show Reverse Up Thrust (RUT)
- Mark reverse upthrusts. As written the condition never holds, so no mark appears.
- Show Buy Condition Exist (BCE)
- Mark an up bar that follows a sign of strength.
- Show Sell Condition Exist (SCE)
- Mark the first bar on which an upthrust is confirmed.
- Show Buying Climax (BC)
- Mark a wide bar closing in its upper half on the highest volume of 60 bars in a major up trend.
- Show Selling Climax (SC)
- Mark a wide bar closing in its lower half on the highest volume of 60 bars in a major down trend.
- Show Two bar Reversal (TB)
- Mark two bar reversals: an outside bar closing high after a fall, or closing low after a rise.
- Show Ease of Movement (FOM)
- Mark DS where volume above 1.5 times average moved the price less than half its average body.
- Show Alert window?
- Show the alert log in the bottom left corner.
- # of message to show
- How many of the newest messages the log shows, up to 20.
- # of messages to offset
- Skip this many of the newest messages, to page back through older ones.
- period
- Bars in the money flow index read by the status table.
- Show support and resistance lines
- Draw a line at the latest new high and the latest new low, each holding until the next one.
- Sensitivity
- How many earlier bars a high or low has to beat to move the support or resistance line.
- Show high volume lines
- Draw lines at the high and low of the latest high volume bar and the bar before it.
- Vol Length
- Bars in the volume average that decides a high volume bar.
- Vol Factor
- How many times the average volume a bar needs to count as high volume.
- Minimum volume
- The least volume a bar needs before it can count as high volume.
Frequently asked questions
What do the codes on the chart mean?
Above the bars: UT upthrust, TRB top reversal, TC trend change, PUT and PUC pseudo upthrust, ND no demand, EUF effort up failed, ED effort down, SCE sell condition, BC buying climax. Below the bars: NS no supply, LVT low volume test, ST strength, SV stopping volume, EU effort up, EDF effort down failed, BCE buy condition, SC selling climax. TB is a two bar reversal on either side and DS high volume that could not move the price.
Which timeframe should I use?
It is meant for hourly and daily charts. The averages count bars, so the 60 bar volume average covers about three months of daily bars, about ten sessions of hourly bars on a stock, and two and a half days on a market that trades around the clock. Signs on a daily chart describe a longer stretch of trading.
Why does Reverse Upthrust (RUT) never appear?
Its condition asks for an up bar that also closed below the previous close, which cannot happen. It is kept as written because the effort down failed reading and the strength readings refer to it.
Does it place orders?
No. It is a study: it marks the chart, colours the candles and fills the two tables. Acting on its signs is a separate strategy script.