Data Cleaning
Real data is messy. Handle the missing values (yes, the NaN yfinance leaves behind), wrong types and duplicates that quietly ruin results.
- ·Spotting missing data
- ·dropna & fillna
- ·Why NaN appears
- ·Fixing data types
- ·Removing duplicates
- ·Sanity checks
There's a saying among data professionals: you spend 80% of your time cleaning data and the other 20% complaining about cleaning data. It's only half a joke. Real market data arrives messy - missing values, numbers stored as text, duplicate rows, the odd impossible price. Skip the cleaning and every calculation downstream is quietly wrong. This chapter gives you the small, essential toolkit that turns raw, untrustworthy data into something you can actually compute on.
Spotting missing data
Missing values in pandas show up as NaN ("not a number"). You met one already - when a trading day hasn't closed yet, yfinance hands back a NaN for that bar. The first job is always to find the gaps, with isna():
import numpy as np
import pandas as pd

# A few Reliance closes - but the latest bar is incomplete (NaN), exactly what
# yfinance hands you for a trading day that has not closed yet.
df = pd.DataFrame({
    "Date":   ["2026-06-22", "2026-06-23", "2026-06-24", "2026-06-25"],
    "Close":  [1326.5, 1309.5, 1313.6, np.nan],
    "Volume": [12931213, 15400184, 11030917, np.nan],
})

print(df)
print()
print("Missing values per column:")
print(df.isna().sum())                          # isna() flags each gap
print("Rows with any gap:", df.isna().any(axis=1).sum())Date Close Volume 0 2026-06-22 1326.5 12931213.0 1 2026-06-23 1309.5 15400184.0 2 2026-06-24 1313.6 11030917.0 3 2026-06-25 NaN NaN Missing values per column: Date 0 Close 1 Volume 1 dtype: int64 Rows with any gap: 1
isna() marks every cell True/False for "is this missing?", and summing gives a tidy count per column. Here today's unfinished bar leaves a NaN in both Close and Volume - one incomplete row, flagged instantly.
This is exactly why we've been quietly adding .dropna() to Indian-stock downloads. Yahoo Finance leaves the current day's bar empty until the market closes and the numbers settle, so a fresh RELIANCE.NS pull often has a trailing NaN. Knowing why the gap is there tells you how to treat it - usually, drop it.
Two cures: drop or fill
There are two honest ways to deal with a gap, and choosing well matters:
import numpy as np
import pandas as pd

df = pd.DataFrame({
    "Date":  ["2026-06-23", "2026-06-24", "2026-06-25"],
    "Close": [1309.5, 1313.6, np.nan],
})

# Option A: drop the incomplete row entirely.
print("dropna() - remove rows with gaps:")
print(df.dropna())
print()

# Option B: fill the gap. ffill carries the last known value forward.
print("ffill() - carry the last value forward:")
print(df.ffill())dropna() - remove rows with gaps:
Date Close
0 2026-06-23 1309.5
1 2026-06-24 1313.6
ffill() - carry the last value forward:
Date Close
0 2026-06-23 1309.5
1 2026-06-24 1313.6
2 2026-06-25 1313.6dropna()removes any row with a gap. This is usually right for a trailing incomplete bar - you simply don't have that day's data yet.ffill()("forward fill") carries the last good value forward to plug the gap. This suits a missing day in the middle of a series (say a feed hiccup), where you'd rather hold the last price than punch a hole in your chart.
The rule of thumb: drop gaps at the ends, fill gaps in the middle - and always know which you did, because it changes your numbers.
Fixing types and duplicates
Two more common messes: numbers that arrived as text, and rows that appear twice:
import pandas as pd

# A messier table: prices stored as TEXT, and a duplicated TCS row.
df = pd.DataFrame({
    "Symbol": ["RELIANCE", "TCS", "TCS", "INFY"],
    "Close":  ["1313.60", "2109.00", "2109.00", "1056.60"],   # note: text, not numbers
})

print("Close dtype before:", df["Close"].dtype)      # object = text

df["Close"] = df["Close"].astype(float)              # convert text -> numbers
print("Close dtype after :", df["Close"].dtype)      # float64

clean = df.drop_duplicates()                          # remove the repeated row
print()
print("After dropping duplicates:")
print(clean)
print("Total close value:", round(clean["Close"].sum(), 2))Close dtype before: object
Close dtype after : float64
After dropping duplicates:
Symbol Close
0 RELIANCE 1313.6
1 TCS 2109.0
3 INFY 1056.6
Total close value: 4479.2A price stored as the string "1313.60" can't be added or averaged until you convert it with .astype(float) - that "text that looks like a number" trap from Chapter 5, now at table scale. And drop_duplicates() removes repeated rows (here a doubled TCS), so they don't quietly double-count in your totals.
NaN is so strange it isn't even equal to itself. Ask Python whether a missing value equals a missing value - np.nan == np.nan - and the answer is False. It's not a pandas bug; it's written into IEEE-754, the standard that governs how computers store decimals: "not a number" is defined to never equal anything, including another "not a number." This is precisely why you must test for gaps with isna(), never with == NaN - a comparison that would silently always be False and miss every gap.
Seeing the gaps
Missing data is easy to ignore until you plot it - then a hole, or a suspicious flat line, jumps out:
from pathlib import Path

import matplotlib

matplotlib.use("Agg")
import matplotlib.pyplot as plt
import numpy as np
import pandas as pd
import seaborn as sns

days = pd.RangeIndex(1, 9)
prices = pd.Series([100, 102, np.nan, np.nan, 105, 106, 104, 107.0], index=days)

# A line plot leaves a visible gap wherever data is missing.
sns.set_theme(style="whitegrid")
fig, ax = plt.subplots(figsize=(8, 4))
ax.plot(days, prices, "o-", color="#c98f8f", lw=1.8, label="raw (gaps where NaN)")
ax.plot(days, prices.ffill(), "o--", color="#7c83ff", lw=1.4, alpha=0.85, label="forward-filled")
ax.set_title("Missing data - the gap, and one way to bridge it")
ax.set_xlabel("Day")
ax.set_ylabel("Price")
ax.legend()

out = Path(__file__).with_suffix(".png")
plt.savefig(out, dpi=110, bbox_inches="tight")
print("Missing on days:", list(days[prices.isna()]))Missing on days: [3, 4]
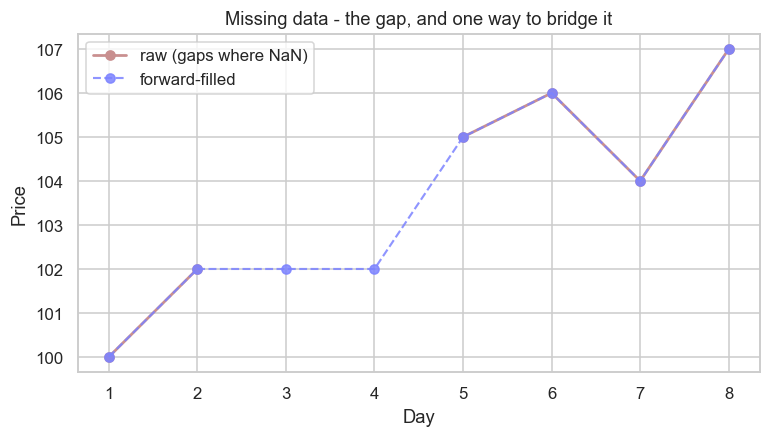
The raw line simply breaks where data is missing; the forward-filled line bridges the gap with a flat segment (the held-over price). Eyeballing a chart is one of the fastest sanity checks you have.
A quick sanity-check routine
Before trusting any dataset, run this thirty-second checklist:
df.shape- the right number of rows and columns?df.isna().sum()- where are the gaps?df.dtypes- is everything the type it should be (prices as numbers, not text)?df.duplicated().sum()- any repeated rows?df.describe()- any impossible values (a negative price, a 10,000% move)?
Five lines, and you've caught the problems that would otherwise poison everything downstream.
Try it yourself
- Build a Series
pd.Series([100, np.nan, 102])and confirm.isna().sum()reports exactly one gap. - On that Series, compare
.dropna()(two values) with.fillna(0)(the gap becomes0) - and notice why filling a price with0would be a terrible idea. - Make a DataFrame with a duplicated row and remove it with
drop_duplicates(); check.shapebefore and after.
Recap
- Missing data appears as
NaN; find it withisna().sum(), and never test for it with==(sinceNaN != NaN). dropna()removes rows with gaps (best for trailing incomplete bars);ffill()bridges gaps (best for holes in the middle).- Fix wrong types with
.astype(float)and repeated rows withdrop_duplicates(). - Run a quick sanity-check routine (
shape,isna,dtypes,duplicated,describe) on every new dataset.
Your data is now clean and trustworthy. Time to exploit the most powerful thing about market data: it's ordered in time. In the next chapter we use the datetime index to resample daily bars into weekly ones and compute rolling averages - the bread and butter of price analysis.