The Market Landscape
A trader's-eye map of where this data comes from - NSE and BSE, US exchanges, indices and the segments you'll meet.
- ·NSE, BSE & SEBI
- ·US exchanges
- ·Cash vs derivatives
- ·Major indices
- ·Demat & settlement, briefly
- ·Where data comes from
Welcome to the final module. You've built a genuine data toolkit - now we turn it on the markets themselves. Before we fetch live quotes and build signals, you need a mental map of where all this data lives: the exchanges that host trading, the regulator that watches over it, the segments you can trade, and the indices that sum it all up. This chapter is light on code and heavy on orientation - the lay of the land every trader-programmer should carry in their head.
The Indian market: who's who
The Indian market is a small cast of institutions, each with a clear job:
- SEBI (the Securities and Exchange Board of India) is the regulator - it writes the rules and polices the market.
- The NSE and BSE are the two exchanges where trades are matched. The NSE dominates volume (it's the world's largest derivatives exchange by number of contracts); the BSE is the historic one.
- Each exchange has a cash/equity segment (buying actual shares) and a derivatives segment (futures and options - "F&O").
- Behind the scenes, depositories (NSDL and CDSL) hold your shares electronically (your "demat" account), and trades settle T+1 - one business day after you trade.
India's market: SEBI regulates; NSE and BSE are the exchanges; each has a cash and a derivatives segment; NSDL/CDSL hold shares and settle trades T+1. That hierarchy - regulator, exchange, segment - repeats in every market in the world.
The US market
The US looks almost identical with different names: the SEC is the regulator (SEBI's counterpart), the NYSE and Nasdaq are the big exchanges, and the same cash-vs-derivatives split applies. Learn one market's structure and you've largely learned them all - which is exactly why the skills in this course travel across borders.
Indices: the market's pulse
You can't watch 2,000 stocks at once, so the market is summarised by indices - baskets that track the whole. In India the headline ones are the Nifty 50 (NSE's top 50) and the Sensex (BSE's top 30); in the US, the S&P 500, the Nasdaq Composite, and the Dow. Here are their live levels, fetched the same way you'd fetch any stock:
import yfinance as yf

# The headline indices, by their Yahoo Finance symbols (^ marks an index).
indices = {
    "Nifty 50 (NSE)": "^NSEI",
    "Sensex (BSE)":   "^BSESN",
    "S&P 500 (US)":   "^GSPC",
    "Nasdaq (US)":    "^IXIC",
}

for name, symbol in indices.items():
    close = yf.Ticker(symbol).history(period="5d")["Close"].dropna()
    last = float(close.iloc[-1])
    chg = (close.iloc[-1] / close.iloc[-2] - 1) * 100
print(f"{name:16} {last:>12,.2f} ({chg:+.2f}%)")Nifty 50 (NSE) 24,021.65 (+0.83%) Sensex (BSE) 76,991.22 (+1.04%) S&P 500 (US) 7,358.22 (-0.10%) Nasdaq (US) 25,476.63 (-0.43%)
Notice the symbols start with ^ - Yahoo's marker for an index rather than a tradeable stock (^NSEI is the Nifty 50, ^GSPC the S&P 500). When someone says "the market was up today," they mean an index like these.
India vs US, at a glance
Because an index is just a price series, everything from Module 4 applies - including rebasing two of them to 100 for a fair growth comparison:
from pathlib import Path

import matplotlib

matplotlib.use("Agg")
import matplotlib.pyplot as plt
import seaborn as sns
import yfinance as yf

sns.set_theme(style="whitegrid")
fig, ax = plt.subplots(figsize=(8, 4))

# Rebase each index to 100 so we compare growth, not levels.
for name, sym, color in [("Nifty 50 (India)", "^NSEI", "#21c87a"),
                         ("S&P 500 (US)", "^GSPC", "#7c83ff")]:
    close = yf.Ticker(sym).history(period="1y")["Close"].dropna()
    ax.plot(close.index, close / close.iloc[0] * 100, lw=1.8, label=name, color=color)

ax.axhline(100, color="#888", ls="--", lw=1)
ax.set_title("One year, rebased to 100: India vs US")
ax.set_ylabel("Rebased to 100")
ax.legend()

out = Path(__file__).with_suffix(".png")
plt.savefig(out, dpi=110, bbox_inches="tight")
print("Charted Nifty 50 vs S&P 500, rebased to 100")Charted Nifty 50 vs S&P 500, rebased to 100
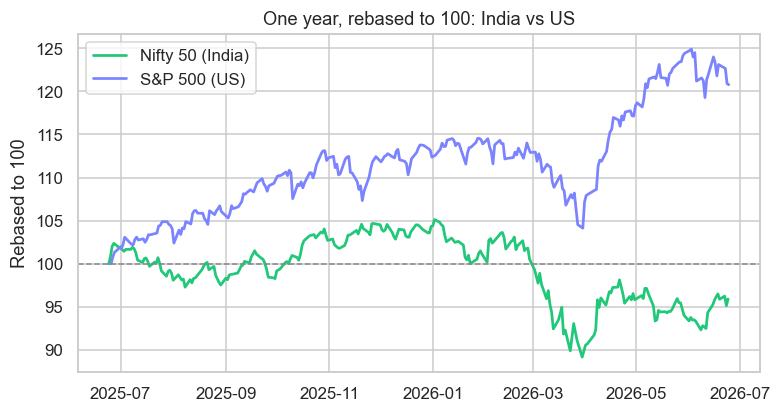
One chart, two of the world's major markets, side by side - built entirely from skills you already have. That's the payoff of the last four modules: real market questions are now just a few lines away.
Asia's oldest stock exchange began under a tree. The Bombay Stock Exchange (BSE) was founded in 1875 - older than the Tokyo or Hong Kong exchanges - and traces its roots to brokers who gathered to trade under banyan trees on what became Dalal Street in Mumbai. From a handful of traders in the shade to an electronic market handling millions of orders a second, it's the same simple idea scaled up beyond recognition: people meeting to agree a price.
Where your data comes from
Every number in this course originates at an exchange, then flows out through data vendors to tools like yfinance (delayed, free) and broker APIs like OpenAlgo (live, your own account). Two flavours matter: delayed data (good enough for studying history and learning) and live data (needed the moment you actually trade). We'll fetch both for real in the next few chapters.
Try it yourself
- Add the Dow Jones (
^DJI) and Bank Nifty (^NSEBANK) to the indices example and re-run. - Rebase the Sensex (
^BSESN) against the Nasdaq (^IXIC) over 6 months - which grew more? - Look up what "T+1 settlement" means for when the shares actually land in your demat account after you buy.
Recap
- Every market shares a structure: a regulator (SEBI / SEC), exchanges (NSE, BSE / NYSE, Nasdaq), and cash vs derivatives segments.
- Depositories (NSDL, CDSL) hold shares; Indian trades settle T+1.
- Indices (Nifty 50, Sensex, S&P 500) summarise the market; on Yahoo their symbols start with
^. - Data flows from exchanges through vendors to you - delayed (yfinance) for study, live (OpenAlgo) for trading.
You now have the map. The next practical snag is names: the same company is RELIANCE on the NSE, RELIANCE.NS on Yahoo, and a stock like Apple is simply AAPL. The next chapter untangles symbols, tickers and lot sizes so you can always find the data you want.