Returns, Signals & Performance
Everything you've learned, on one chart - turn prices into returns, a moving-average crossover into a signal, and judge it with win-rate and drawdown. Then: where to go next.
- ·Prices to returns
- ·A moving-average signal
- ·Crossovers in pandas
- ·Win-rate & average move
- ·Maximum drawdown
- ·Where to go from here
Here we are - the final chapter. Over thirty-nine chapters you went from never having written a line of code to loading, cleaning, charting and fetching real market data. Now we tie it all together. Step by step, we'll turn raw prices into returns, returns into a trading signal, and a signal into a performance scorecard - the exact pipeline every systematic trader runs. This isn't a strategy to trade; it's a walk through the whole craft, using only skills you already have.
From prices to returns
Everything starts by turning prices into returns - the percentage changes that are the true language of performance:
import pandas as pd

df = pd.read_csv("reliance_6mo.csv", index_col="Date", parse_dates=True)
close = df["Close"]

ret = close.pct_change()
print("Daily return, last 3 days (%):")
print((ret.tail(3) * 100).round(2))
print()

# Cumulative growth of 1 rupee held for the whole period (buy-and-hold).
growth = (1 + ret).cumprod()
total = (growth.iloc[-1] - 1) * 100
print(f"Buy-and-hold return : {total:+.2f}%")
print(f"Best day            : {ret.max() * 100:+.2f}%")
print(f"Worst day : {ret.min() * 100:+.2f}%")Daily return, last 3 days (%): Date 2026-06-22 1.30 2026-06-23 -1.28 2026-06-24 0.31 Name: Close, dtype: float64 Buy-and-hold return : -15.31% Best day : +3.36% Worst day : -4.60%
pct_change() gives the daily returns; (1 + ret).cumprod() compounds them into total growth. Over this particular six months, simply holding Reliance lost 15.3% - a useful reminder that "buy and hold" is not a guarantee, and that measuring honestly is the whole point.
A signal: the moving-average crossover
A signal is a rule that turns data into a decision. The classic one: go long when a fast moving average crosses above a slow one, and exit when it crosses back below:
from pathlib import Path

import matplotlib

matplotlib.use("Agg")
import matplotlib.pyplot as plt
import pandas as pd
import seaborn as sns

df = pd.read_csv("reliance_6mo.csv", index_col="Date", parse_dates=True)
close = df["Close"]

fast = close.rolling(10).mean()        # short moving average
slow = close.rolling(30).mean()        # long moving average

# Signal: in the market when the fast average is above the slow one.
position = (fast > slow).astype(int)
cross = position.diff()                # +1 = a fresh buy, -1 = a fresh sell
buys = close[cross == 1]
sells = close[cross == -1]

sns.set_theme(style="whitegrid")
fig, ax = plt.subplots(figsize=(9, 4.5))
ax.plot(close.index, close, color="#9aa0c4", lw=1.1, label="Close")
ax.plot(fast.index, fast, color="#7c83ff", lw=1.6, label="10-day SMA")
ax.plot(slow.index, slow, color="#e0a06a", lw=1.6, label="30-day SMA")
ax.scatter(buys.index, buys, marker="^", color="#21c87a", s=95, label="Buy", zorder=5)
ax.scatter(sells.index, sells, marker="v", color="#e05a5a", s=95, label="Sell", zorder=5)
ax.set_title("RELIANCE - 10/30 moving-average crossover")
ax.set_ylabel("Price (Rs)")
ax.legend(loc="upper right", fontsize=8)

out = Path(__file__).with_suffix(".png")
plt.savefig(out, dpi=110, bbox_inches="tight")
print(f"Buy signals : {(cross == 1).sum()}")
print(f"Sell signals: {(cross == -1).sum()}")Buy signals : 2 Sell signals: 2
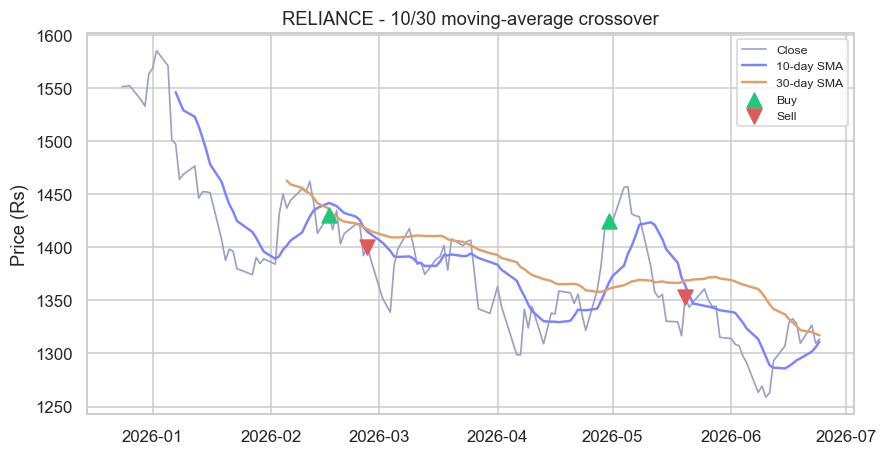
Look how little code it took. fast > slow makes a True/False position; .diff() finds the exact days it changes - a +1 is a fresh buy (green triangle), a -1 a sell (red). Every piece - rolling averages, boolean masks, plotting - came from earlier chapters. You just combined them into a real trading rule.
A moving-average crossover is a complete signal in three lines: compute a fast and a slow average, take a position when fast > slow, and use .diff() to mark the crossover days. Simple rules, built from skills you already have.
A performance scorecard
A signal is worthless until you measure it. The honest questions: how often does it win, by how much, and how bad does it get? Here's a basic scorecard on the underlying returns:
import pandas as pd

df = pd.read_csv("reliance_6mo.csv", index_col="Date", parse_dates=True)
close = df["Close"]
ret = close.pct_change().dropna()

# Win rate: how often the stock closed up, and by how much on average.
wins = (ret > 0).sum()
print(f"Up days     : {wins} of {len(ret)}  ({wins / len(ret) * 100:.1f}% win rate)")
print(f"Avg up day  : {ret[ret > 0].mean() * 100:+.2f}%")
print(f"Avg down day: {ret[ret < 0].mean() * 100:+.2f}%")
print()

# Maximum drawdown: the worst peak-to-trough fall along the way.
growth = (1 + ret).cumprod()
drawdown = (growth / growth.cummax() - 1) * 100
print(f"Maximum drawdown: {drawdown.min():.2f}%")Up days : 55 of 123 (44.7% win rate) Avg up day : +1.12% Avg down day: -1.18% Maximum drawdown: -20.58%
Three numbers that matter: a 44.7% win rate (down days slightly outnumbered up days), an average win and loss of similar size, and a maximum drawdown of -20.6% - the worst peak-to-trough fall you'd have endured. That last number is the one that tests your nerve in real life, and it's why professionals obsess over drawdown, not just returns.
This is a study exercise, not advice. Six months is far too little data to conclude anything, we ignored trading costs entirely (which, as a real strategy, would erode the result), and a single backtest proves nothing. The value here is the process - prices to returns to signal to honest measurement - not this particular result. Learning to measure rigorously, and to distrust a pretty backtest, is the real skill.
The signal you just built has a famous nickname. When the 50-day average crosses above the 200-day, traders call it a "golden cross" (bullish); when it crosses below, a "death cross" (bearish) - terms financial news still puts in headlines. It's among the oldest systematic signals in existence, which carries a quietly encouraging lesson for everything ahead: a powerful idea in markets needn't be complicated. Clarity beats cleverness here, just as it did in your code.
Where to go next
Take a moment - you've come a very long way. You started not knowing what a variable was; you can now load real market data, clean it, analyse it across time, visualise it, fetch it live, and turn it into a measured trading signal. That is a genuine, marketable skill set, and it's yours.
Where to point it next:
- Keep practising on real data. Pick a stock you follow, pull its history, and recreate this chapter's pipeline yourself. Repetition is what turns knowledge into fluency.
- Go deeper into algorithmic trading with the OpenAlgo Python (Algo Trading) course - it builds on everything here to place real orders, manage positions, and run live strategies through the OpenAlgo SDK you met in Chapter 37.
- Go deeper into the markets themselves with the Quantitative Trading course - market microstructure, the mathematics of price, options and volatility, and how to find an edge that survives costs (the costs we deliberately skipped above).
Whichever path you take, the foundation is the same one you just built. Python stopped being a mystery several chapters ago; from here, it's simply your tool. Go use it.
Recap
- Returns (
pct_change,cumprod) are the language of performance - and buy-and-hold can lose, so always measure. - A signal can be as simple as a moving-average crossover: position on
fast > slow, crossovers via.diff(). - A scorecard - win rate, average move, maximum drawdown - tells you whether a signal is any good; drawdown tests your nerve.
- Treat every backtest with healthy suspicion: short samples, ignored costs and single tests all mislead. The process matters more than any one result.
- You've finished Python for Traders - next, deepen into the Algo Trading and Quantitative Trading courses, and keep building on real data.