Put Ratio Back Spread, Synthetic and Risk Reversal
Three more bearish shapes. Learn the put ratio back spread (cheap, explosive downside), the short synthetic future and the risk reversal, with their live payoffs and the risks to respect.
- ·The put ratio back spread
- ·The short synthetic future
- ·Why it equals a short future
- ·The risk reversal
- ·Where the unlimited risk hides
- ·Reading the live payoffs
The two bear spreads you just built were polite, defined-risk trades with capped rewards on both ends. This chapter steps up to three bolder bearish shapes, each chasing a much larger payoff on a fall, and two of them carry a tail of loss that never closes on the upside. You will meet the put ratio back spread, which costs little and pays enormously on a real break lower; the short synthetic future, where one call and one put behave exactly like selling a NIFTY future; and the risk reversal, a bearish collar that opens for a credit. Each is assembled from legs you already know, and each leans hard on the downside in a different way.
The one-line idea
All three trades share a bearish lean, but they split sharply on where the risk lives. The put ratio back spread keeps its worst case printed on the ticket and pays without limit on a crash. The short synthetic future and the risk reversal both open for a credit and finish profitable more often, but each sells a call with nothing above it, so a rally costs without end. Read each one by where its loss is capped and where it is not.
A put ratio back spread is a cheap, defined-risk bet that pays hugely on a hard fall. A short synthetic future is two options that equal a short NIFTY future, with uncapped upside risk. A risk reversal is a bearish collar opened for a credit, also with uncapped upside risk. The first is beginner-safe; the other two are leveraged shorts that demand respect and a large margin.
The put ratio back spread
A ratio back spread deliberately breaks the one-for-one balance of an ordinary spread. You sell one at-the-money put and buy two puts a strike lower, so you end up holding one extra put, which means you profit powerfully if NIFTY falls hard.
| Leg | Action | Strike | Premium per share | Cash flow per lot of 65 |
|---|---|---|---|---|
| 1 | Sell put | 24,050 | 295.1 received | plus Rs 19,182 in |
| 2 | Buy put (x2) | 23,950 | 256.6 each, paid | Rs 33,352 out |
| Net debit | Rs 14,170 out |
The one put you sell brings in Rs 19,182, and the two puts you buy cost Rs 33,352 together, so the position opens for a small net debit of Rs 14,170. Because you own one more put than you sold, a deep fall lets that extra put run, all the way to a maximum profit labelled Rs 1,536,080 if NIFTY collapsed toward zero. Treat that figure as shorthand for "very large on a crash."
| Number | How it is built | This trade |
|---|---|---|
| Max profit | the extra long put gains without limit as NIFTY falls toward zero | Rs 1,536,080 |
| Max loss | at 23,950 the sold put is 100 points against you, plus the debit | Rs 6,500 plus Rs 14,170 = Rs 20,670 |
| Breakeven | the short strike minus the valley loss spread over the one net put | 23,950 minus 318 = 23,632 |
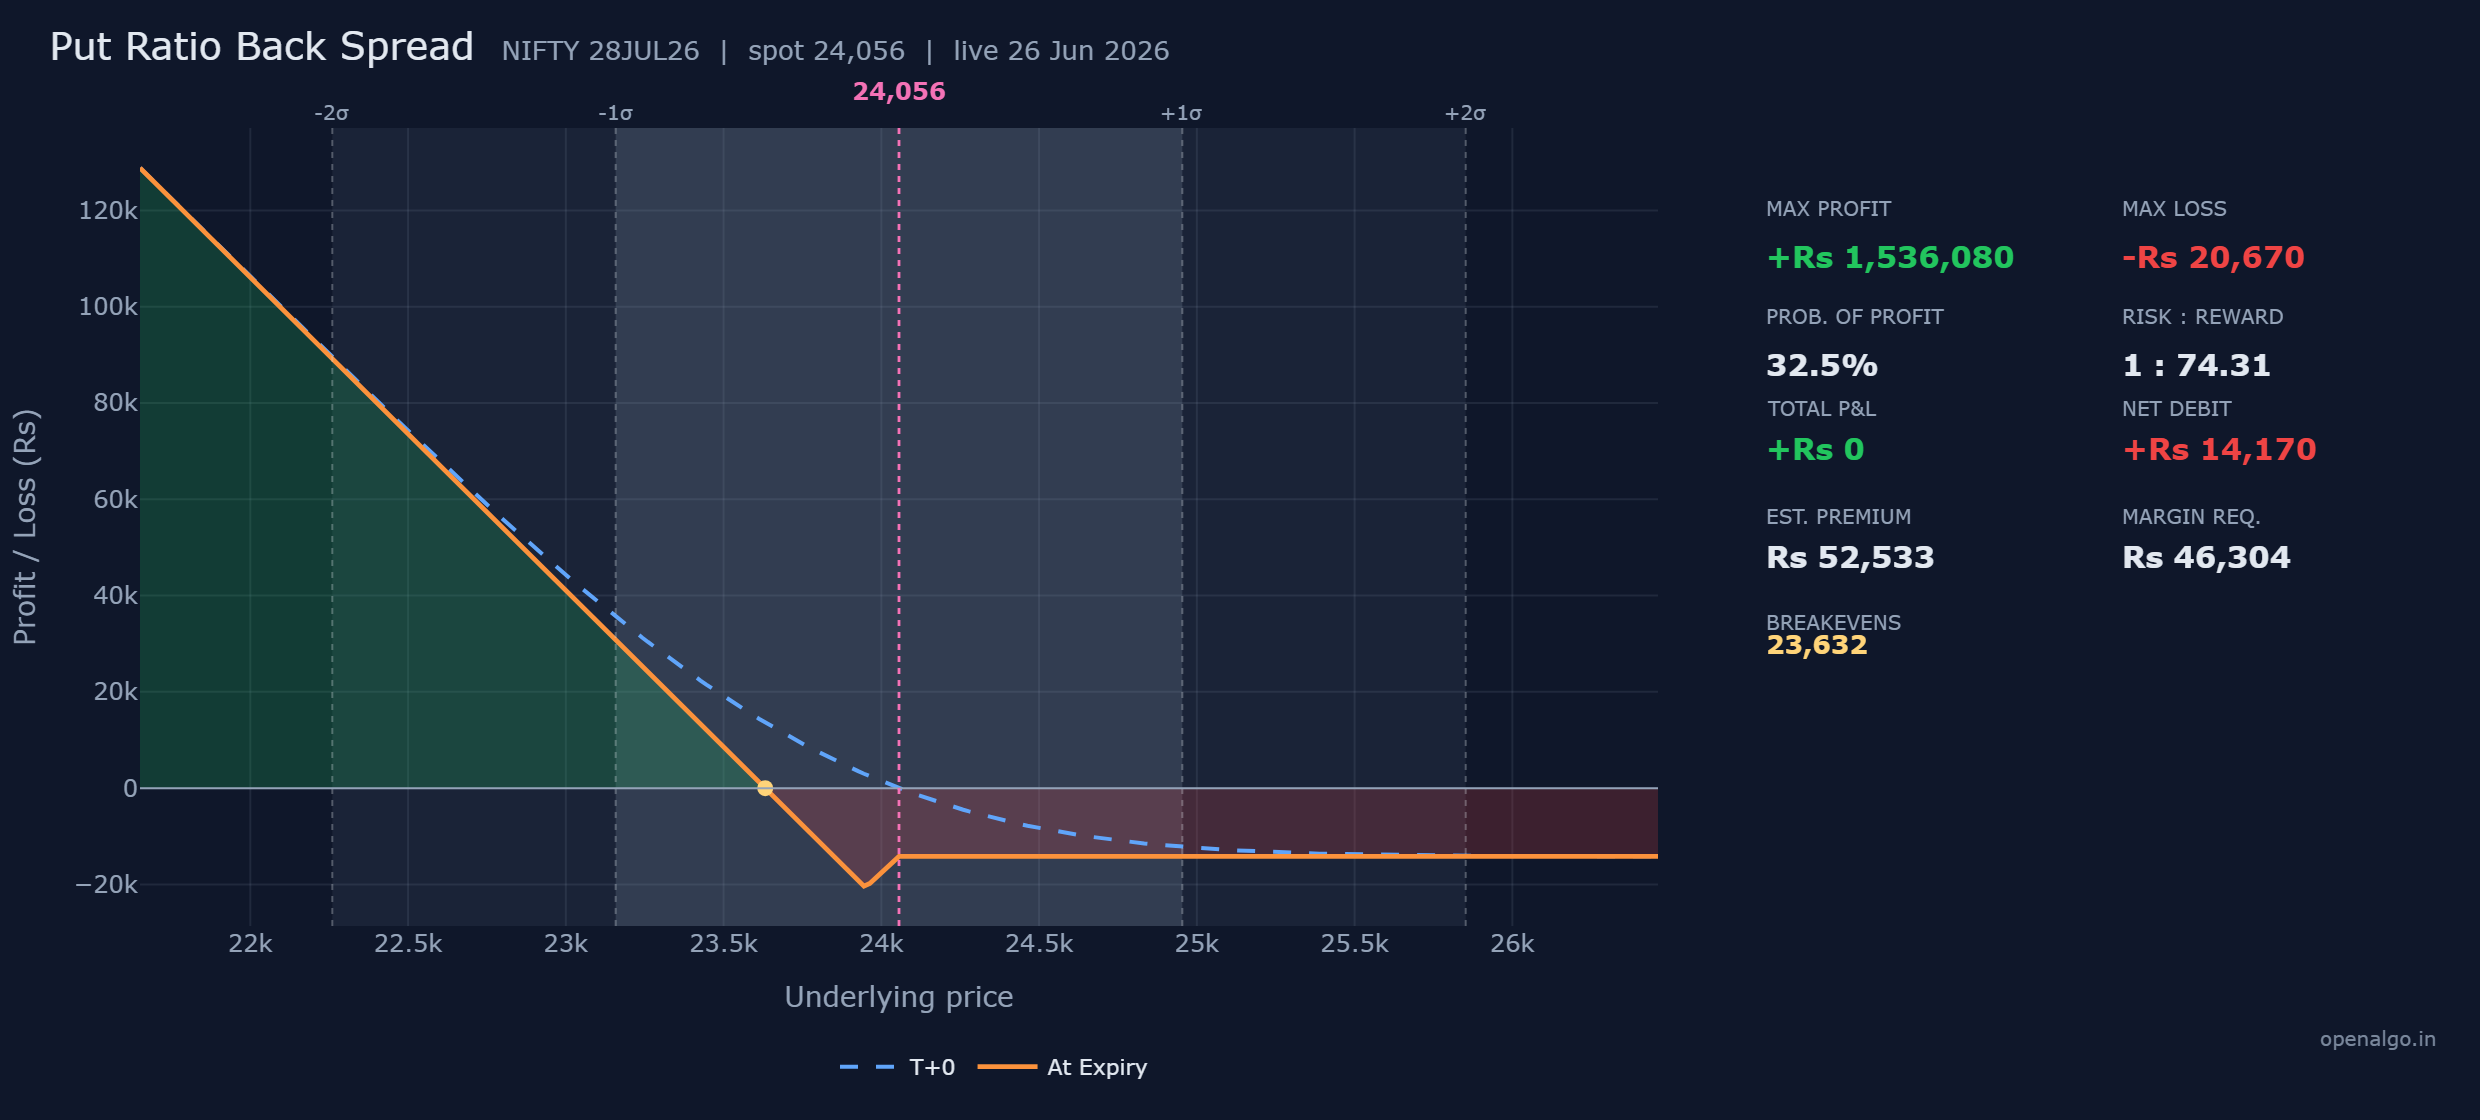
The danger here is not on the upside, it is in the middle. Your worst case lands not on a big move but on a small one, exactly at the 23,950 short strike, where the put you sold is 100 points in the money against you while both puts you bought are still worthless. Here is the trade settled at five levels of NIFTY, per lot.
| NIFTY at expiry | 24,050 put you sold | 23,950 puts you bought (two) | Net profit or loss |
|---|---|---|---|
| 24,200 | worth 0 | worth 0 | minus Rs 14,170 (debit only) |
| 23,950 | worth 100 | worth 0 | minus Rs 20,670 (max loss) |
| 23,632 | worth 418 | worth 636 | Rs 0 (breakeven) |
| 23,300 | worth 750 | worth 1,300 | plus Rs 21,580 |
| 23,000 | worth 1,050 | worth 1,900 | plus Rs 41,080 |
Read it and the odd shape makes sense. Above the strikes you lose only the debit, and a small slide to 23,950 is the single worst place to land. Below the breakeven of 23,632 the second long put has paid back everything, and from there the profit accelerates the further NIFTY drops. The 32 percent probability of profit is the honest price of that geometry: this trade rewards a real fall, not a gentle drift.
The short synthetic future
The next shape copies a futures position out of two options. Sell the at-the-money call and buy the at-the-money put at the same 24,050 strike, and the pair behaves exactly like a short NIFTY future, a single straight diagonal line of profit and loss.
| Leg | Action | Strike | Premium per share | Cash flow per lot of 65 |
|---|---|---|---|---|
| 1 | Sell call | 24,050 | 425.8 received | plus Rs 27,677 in |
| 2 | Buy put | 24,050 | 295.1 paid | Rs 19,182 out |
| Net credit | plus Rs 8,496 in |
The call you sell brings in more than the put you buy costs, so the position opens for a small net credit of Rs 8,496. From there it is a straight line. Every point NIFTY falls, you gain 65 rupees. Every point it rises, you lose 65 rupees.
| Number | How it is built | This trade |
|---|---|---|
| Max profit | the long put gains as NIFTY falls toward zero, plus the credit | Rs 1,571,746 |
| Max loss | the sold call has nothing above it | Unlimited |
| Breakeven | the strike plus the credit per share | 24,050 plus 130.7 = 24,181 |
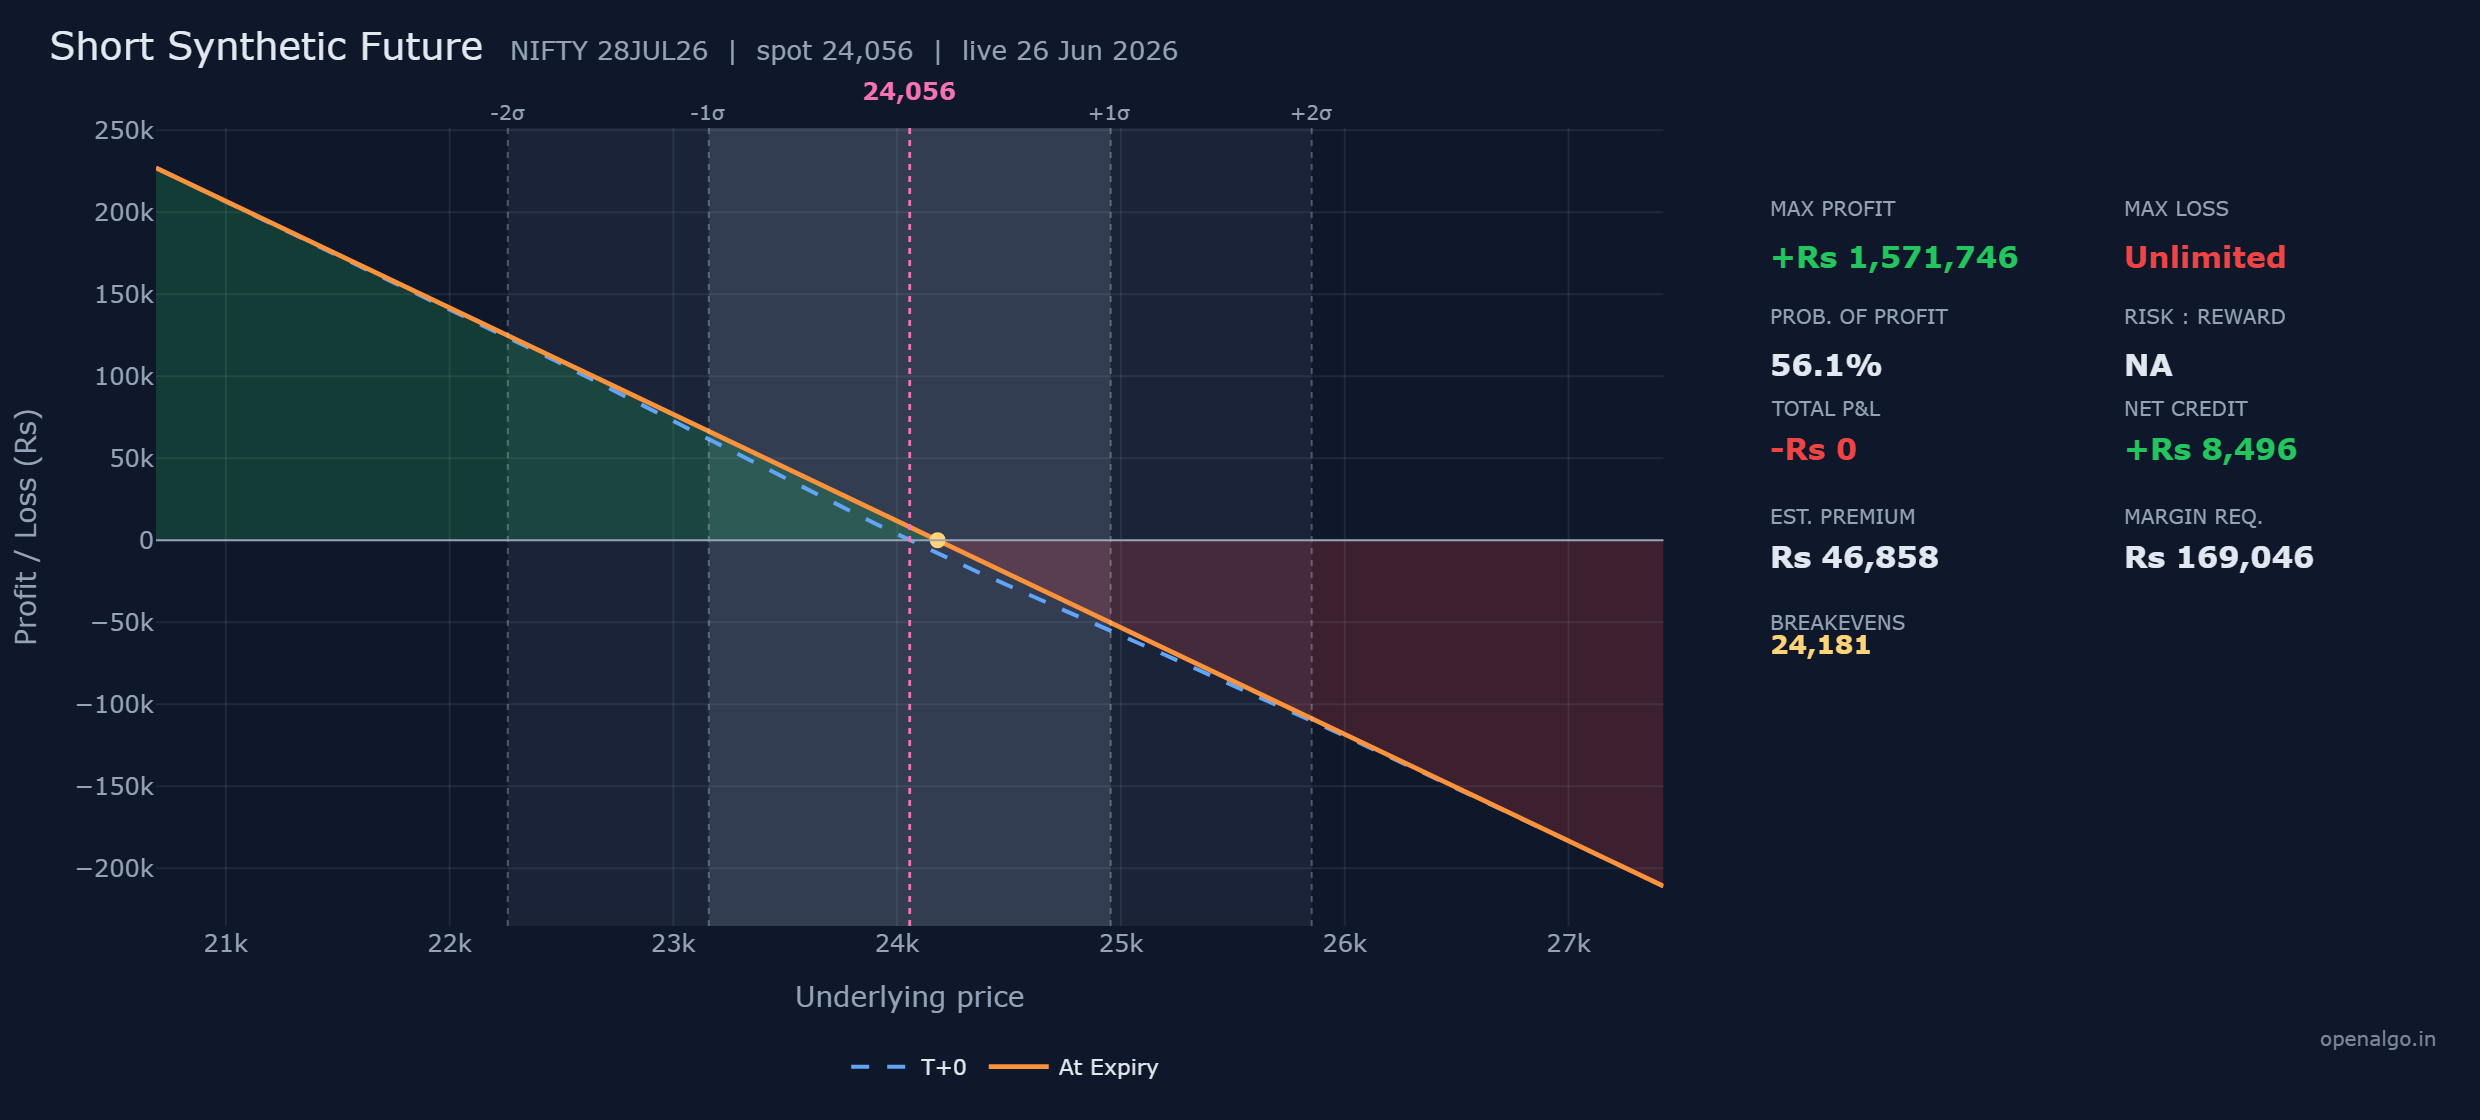
The breakeven at 24,181 is the synthetic future price, sitting just above spot because the cost of carry is baked into the options. Here is the straight line settled at four levels.
| NIFTY at expiry | 24,050 call you sold | 24,050 put you bought | Net profit or loss |
|---|---|---|---|
| 23,550 | worth 0 | worth 500 | plus Rs 40,996 |
| 24,050 | worth 0 | worth 0 | plus Rs 8,496 |
| 24,181 | worth 131 | worth 0 | Rs 0 (breakeven) |
| 24,550 | worth 500 | worth 0 | minus Rs 24,004 |
A short synthetic future has a maximum loss that is UNLIMITED. Because you sold a call with no protection above it, the position loses 65 rupees for every point NIFTY rises, with no ceiling at all. It is a leveraged short on the index, which is exactly why the exchange blocks a margin of about Rs 1.69 lakh. The 56 percent probability of profit does not soften that uncapped tail. A sharp rally can run the loss far past anything you collected.
The synthetic future is not a beginner's first trade. Its real value is conceptual: selling a call while buying a put at one strike equals being short the future, proof that a call and a put are two halves of the same instrument.
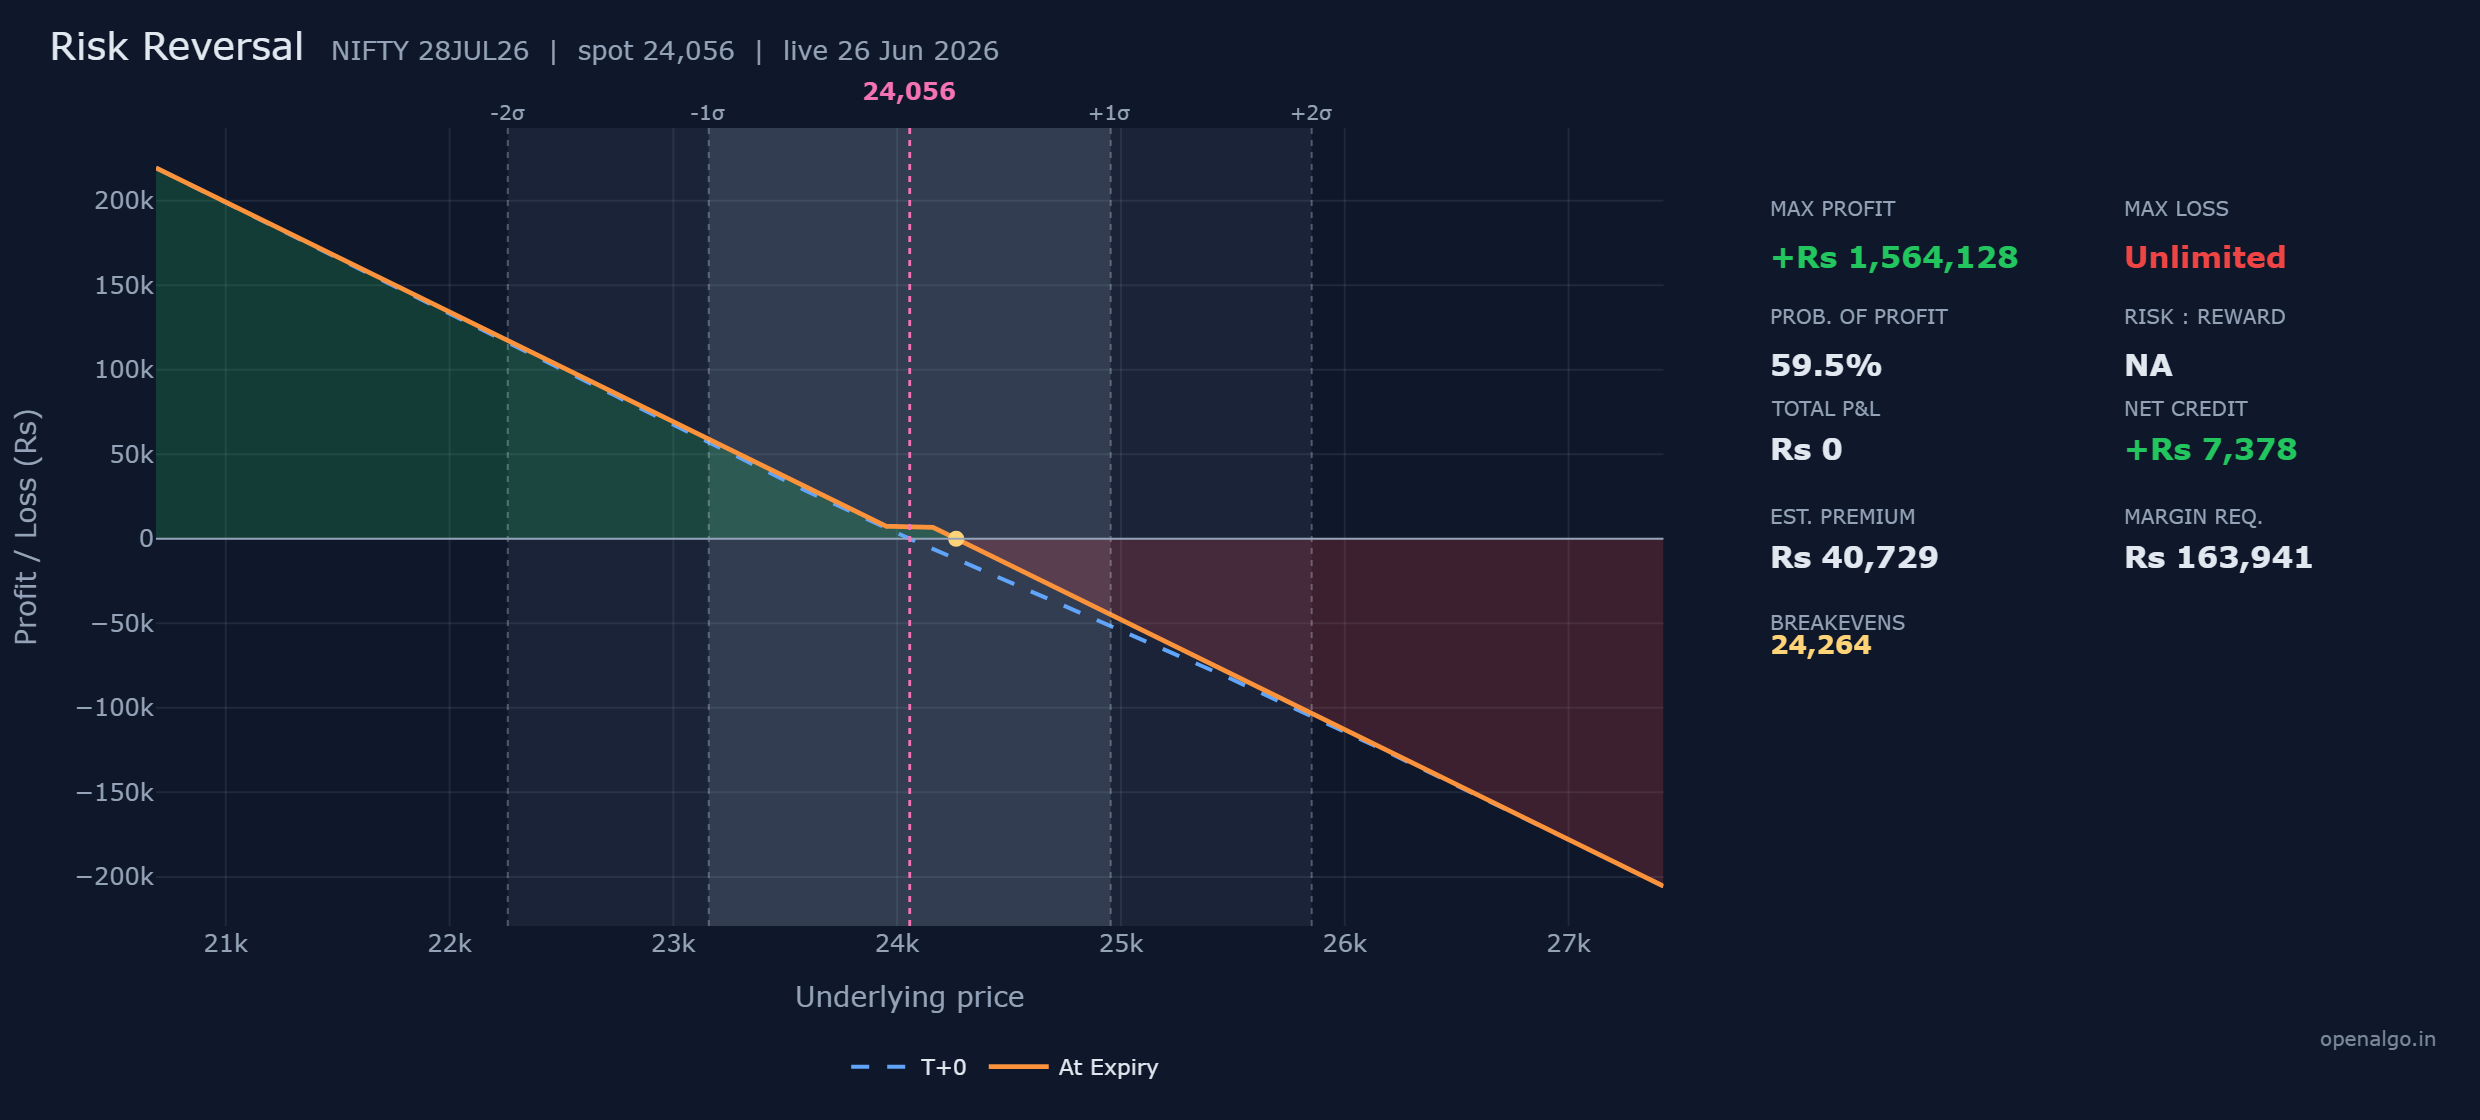
The risk reversal
The last shape softens the synthetic into a bearish collar. You buy a put below the money for downside profit and sell a call above the money to pay for it, leaving a gentle slope in between.
| Leg | Action | Strike | Premium per share | Cash flow per lot of 65 |
|---|---|---|---|---|
| 1 | Buy put | 23,950 | 256.6 paid | Rs 16,679 out |
| 2 | Sell call | 24,150 | 370.1 received | plus Rs 24,057 in |
| Net credit | plus Rs 7,378 in |
The call you sell brings in more than the put you buy costs, so the risk reversal opens for a net credit of Rs 7,378. Below 23,950 the long put profits and the gain grows the further NIFTY falls. Between the two strikes you simply keep the credit. Above 24,150 the sold call turns against you and the loss runs without limit.
| Number | How it is built | This trade |
|---|---|---|
| Max profit | the long put gains as NIFTY falls toward zero, plus the credit | Rs 1,564,128 |
| Max loss | the sold 24,150 call has nothing above it | Unlimited |
| Breakeven | the call strike plus the credit per share | 24,150 plus 113.5 = 24,264 |
Here is the collar settled at five levels of NIFTY, per lot.
| NIFTY at expiry | 23,950 put you bought | 24,150 call you sold | Net profit or loss |
|---|---|---|---|
| 23,450 | worth 500 | worth 0 | plus Rs 39,878 |
| 23,950 | worth 0 | worth 0 | plus Rs 7,378 |
| 24,150 | worth 0 | worth 0 | plus Rs 7,378 |
| 24,264 | worth 0 | worth 114 | Rs 0 (breakeven) |
| 24,550 | worth 0 | worth 400 | minus Rs 18,622 |
Notice the flat shelf of Rs 7,378 running across the whole gap from 23,950 to 24,150. That wide calm band is where the 60 percent probability of profit comes from, but it does nothing to cap the tail above it.
A bearish risk reversal has a maximum loss that is UNLIMITED. The sold 24,150 call has no protection above it, so a rally past the breakeven of 24,264 costs you without limit, and the exchange blocks about Rs 1.64 lakh of margin to hold it. The 60 percent probability of profit comes entirely from the wide gap before the loss begins, not from any ceiling on it. Treat this as a leveraged bearish position, never as a safe income trade.
Your odds across the three
The probabilities of profit tell the same story the shapes do. The put ratio back spread prints just 32 percent, because it needs a genuine fall to clear its valley and reach the accelerating profit line. The short synthetic future sits at 56 percent and the risk reversal at 60 percent, both above half, because each starts with a credit and a wide stretch of price where it simply wins. But high odds bought with an uncapped tail are not safety: those two win more often and lose far worse on the rare day they lose.
Always read the probability of profit next to where the loss is capped. A 60 percent chance of profit on the risk reversal sounds comforting until you notice the other 40 percent has no floor. A 32 percent chance on the put ratio back spread sounds poor until you notice its worst case is a defined Rs 20,670 printed on the ticket. The shape of the loss matters more than the headline odds.
Margin, the cost of an open tail
Look at the three margins side by side and the exchange tells you, in cash, exactly which trades are dangerous.
| Strategy | Net | Max loss | Margin |
|---|---|---|---|
| Put ratio back spread | debit Rs 14,170 | Rs 20,670 | Rs 46,304 |
| Short synthetic future | credit Rs 8,496 | Unlimited | Rs 169,046 |
| Risk reversal | credit Rs 7,378 | Unlimited | Rs 163,941 |
The defined-risk put ratio back spread blocks Rs 46,304, a little more than twice its own worst loss. The two undefined-risk trades each block over Rs 1.6 lakh, because the exchange is holding collateral against a tail that has no end. Whenever a structure ties up that kind of capital, take it as a signal to find where the unlimited side lives before you place it.
Time decay
Time treats the three trades differently. The put ratio back spread is net long one put, so the clock works against it: sitting still near the short strike lets the long puts bleed, part of why a quiet drift to 23,950 is its worst outcome. The short synthetic future has almost no time value at all, so its blue T+0 line and orange at-expiry line lie nearly on top of each other, decaying no more than a real future does. The risk reversal earns a little from decay while NIFTY holds inside its flat band, as the sold call wastes faster than the bought put, but that small help is dwarfed by the directional risk on either side.
How the three compare
The put ratio back spread is the only member of the trio with a defined worst case, Rs 20,670 at 23,950, which makes it the one to reach for first. The short synthetic future is a pure leveraged short, unlimited above 24,181, and the risk reversal is a bearish lean with a wide cushion but the same uncapped tail above 24,264.
If you are bearish and still learning, prefer the put ratio back spread from this trio, or better still the plain bear put spread from the last chapter. Both keep your worst case on the ticket where you can size against it. Leave the short synthetic and the risk reversal until you can actively manage an uncapped short, and never hold one through a known event without a plan to cap the upside first.
You can build all three in sandbox trading (analyzer mode in OpenAlgo), placing the legs and watching the put ratio back spread carve its loss valley, the synthetic draw a perfectly straight line, and the risk reversal slope between its strikes. Drag the modelled price upward on the two credit trades and watch the loss line fall without end. That single sight is the whole lesson. Next we return to defined-risk ground with the bearish butterfly and condor, two cheap, targeted bets on a precise landing below the money.
Key takeaways
- The put ratio back spread sells one put and buys two lower puts for a small debit. Its worst case is a defined Rs 20,670 at 23,950, its breakeven is 23,632, and it pays hugely on a real fall, with a 32 percent chance of profit.
- The short synthetic future sells the 24,050 call and buys the 24,050 put, equalling a short future: a straight line, breakeven 24,181, UNLIMITED loss above it.
- The risk reversal buys the 23,950 put and sells the 24,150 call for a credit, a bearish collar with a flat Rs 7,378 shelf between the strikes and UNLIMITED loss past 24,264.
- The two credit trades show higher odds, 56 and 60 percent, but those odds sit above a tail with no floor, and the exchange blocks over Rs 1.6 lakh of margin against each.
- For a beginner, the defined-risk put ratio back spread is the only one of the trio to reach for first, and only with its worst case sized into the position.