Ratio Back Spread, Synthetic and Range Forward
Three more bullish shapes. Learn the call ratio back spread (cheap, explosive upside), the long synthetic future (calls and puts that mimic a future) and the range forward, with their live payoffs and the risks to watch.
- ·The call ratio back spread
- ·Why it can be a credit trade
- ·The long synthetic future
- ·Why it equals a future
- ·The range forward collar
- ·Reading the live payoffs
So far every bullish trade has had a neat, finite shape. Now we step up in ambition with three structures that trade those tidy caps for something larger and more open-ended, and in two cases far more dangerous. They are all bullish, but each expresses the view differently. The call ratio back spread keeps your downside small while leaving the upside wide open. The long synthetic future turns two options into a straight line that behaves exactly like buying a NIFTY future. The range forward is a bullish collar that mostly sleeps until NIFTY makes a real move. These are the trades where the strategy builder's numbers earn their keep, because the shapes are no longer obvious from the name. All figures use real NIFTY data captured on 26 June 2026, spot 24,056, lot 65, the 28 July 2026 expiry about 32 days away.
The one-line idea
All three structures reach for an unlimited upside, but they pay for it in completely different ways. One caps its loss tightly and risks only a modest sum. The other two rebuild a futures position out of options, so their downside is open and their margin is heavy. The skill this chapter teaches is reading which side of the chart hides the unlimited, or near unlimited, loss.
Unlimited profit is the easy part to see. The honest question is always what sits on the other side. The call ratio back spread risks a defined Rs 26,930. The synthetic future and the range forward each risk well over fifteen lakh on a collapse, because a sold leg leaves the downside open. Same dream, three very different prices.
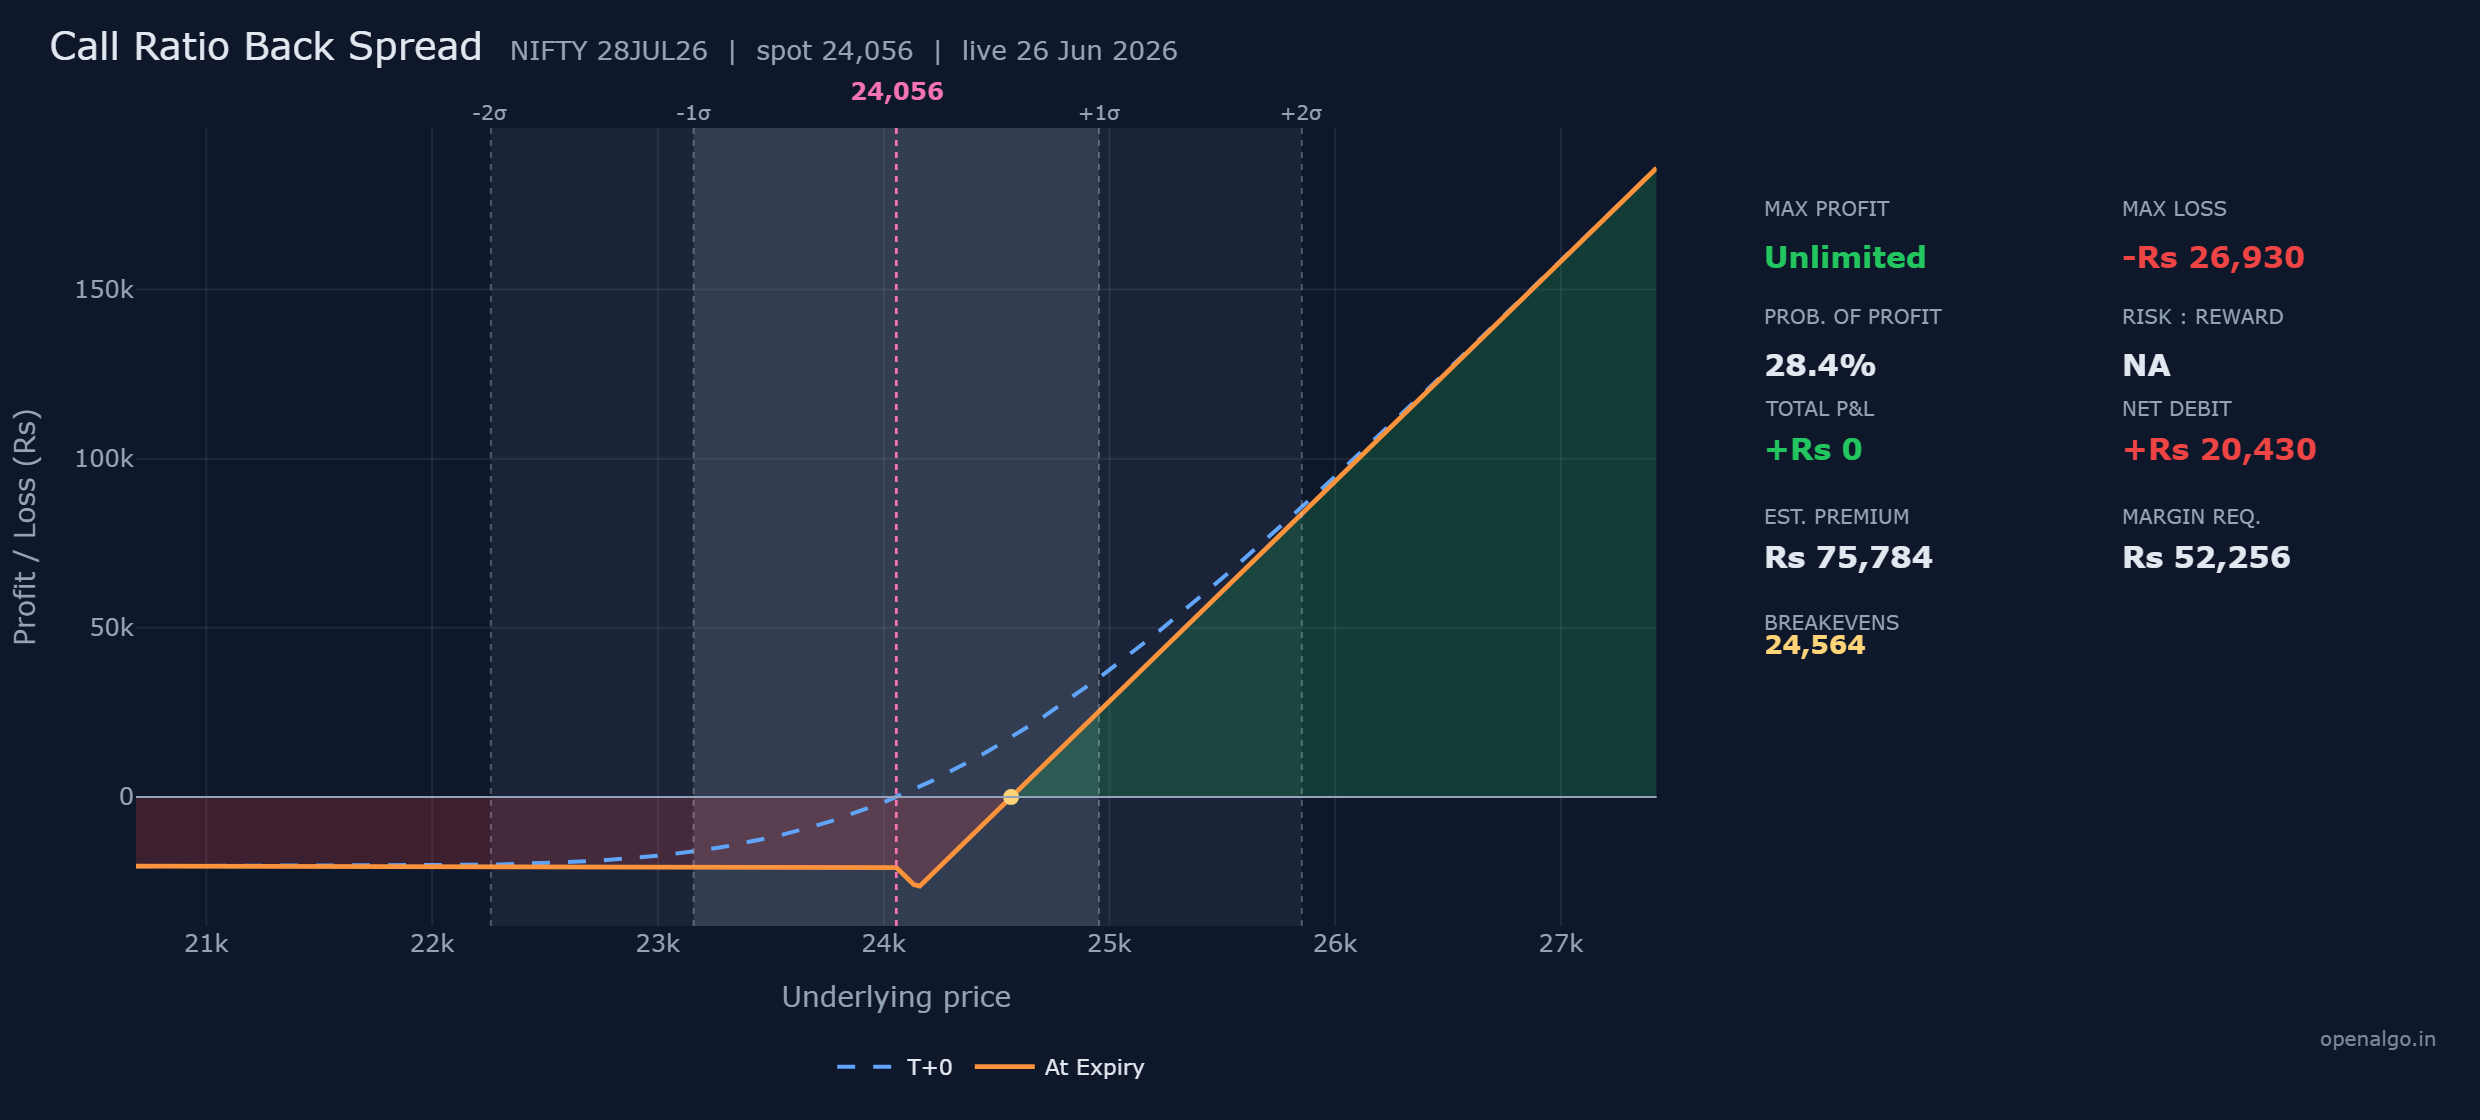
Strategy one: the call ratio back spread
A back spread uses an unequal number of legs. Here you sell one at-the-money call and buy two calls one strike higher.
| Leg | Action | Strike | Premium per share | Cash flow per lot of 65 |
|---|---|---|---|---|
| 1 | Sell 1 call | 24,050 | 425.8 received | plus Rs 27,677 in |
| 2 | Buy 2 calls | 24,150 | 370.1 paid each | Rs 48,107 out (2 lots) |
| Net debit | Rs 20,430 out |
The single sold call funds part of the two you buy, but the pair costs more in total, so you pay a net debit of Rs 20,430. In return you own one extra long call above the strike, and that spare call is what gives the structure its unlimited upside on a strong rally.
The three numbers fall out as follows.
Maximum loss is Rs 26,930, and it lives in the middle, not the tails. Below 24,050 every call expires worthless and you simply lose the net debit. The real pain sits at the 24,150 strike, where the sold call is fully in the money by 100 points but the two bought calls have barely woken. That is the 100-point loss on the short, worth Rs 6,500, plus the Rs 20,430 debit, which together make Rs 26,930.
Breakeven is 24,564. Above 24,150 the two long calls gain twice as fast as the single short loses, a net one point per share, so the position climbs out of its valley and crosses zero once that gain recovers the debit per share. Maximum profit is unlimited above there.
| Number | How it is built | This trade |
|---|---|---|
| Max loss | short call loss at 24,150 plus net debit | Rs 6,500 plus Rs 20,430 equals Rs 26,930 |
| Max profit | one spare long call running free | Unlimited |
| Breakeven | upper crossing where two longs recover the debit | 24,564 |
Now settle it at expiry. The sold call is worth max(NIFTY minus 24,050, 0); the two bought calls are each worth max(NIFTY minus 24,150, 0).
| NIFTY at expiry | 24,050 call sold | 24,150 calls bought (each) | Net profit or loss |
|---|---|---|---|
| 23,900 | worth 0 | worth 0 | minus Rs 20,430 (the debit) |
| 24,150 | worth 100 | worth 0 | minus Rs 26,930 (max loss) |
| 24,564 | worth 514 | worth 414 | about Rs 0 (breakeven) |
| 24,800 | worth 750 | worth 650 | plus Rs 15,320 |
| 25,050 | worth 1,000 | worth 900 | plus Rs 31,570 (and rising) |
Read down and the valley shows itself. The worst case is not a crash but a mild drift up that pins the sold strike at 24,150. This is the rare structure where unlimited means unlimited profit, not unlimited risk, and the loss is a defined Rs 26,930.
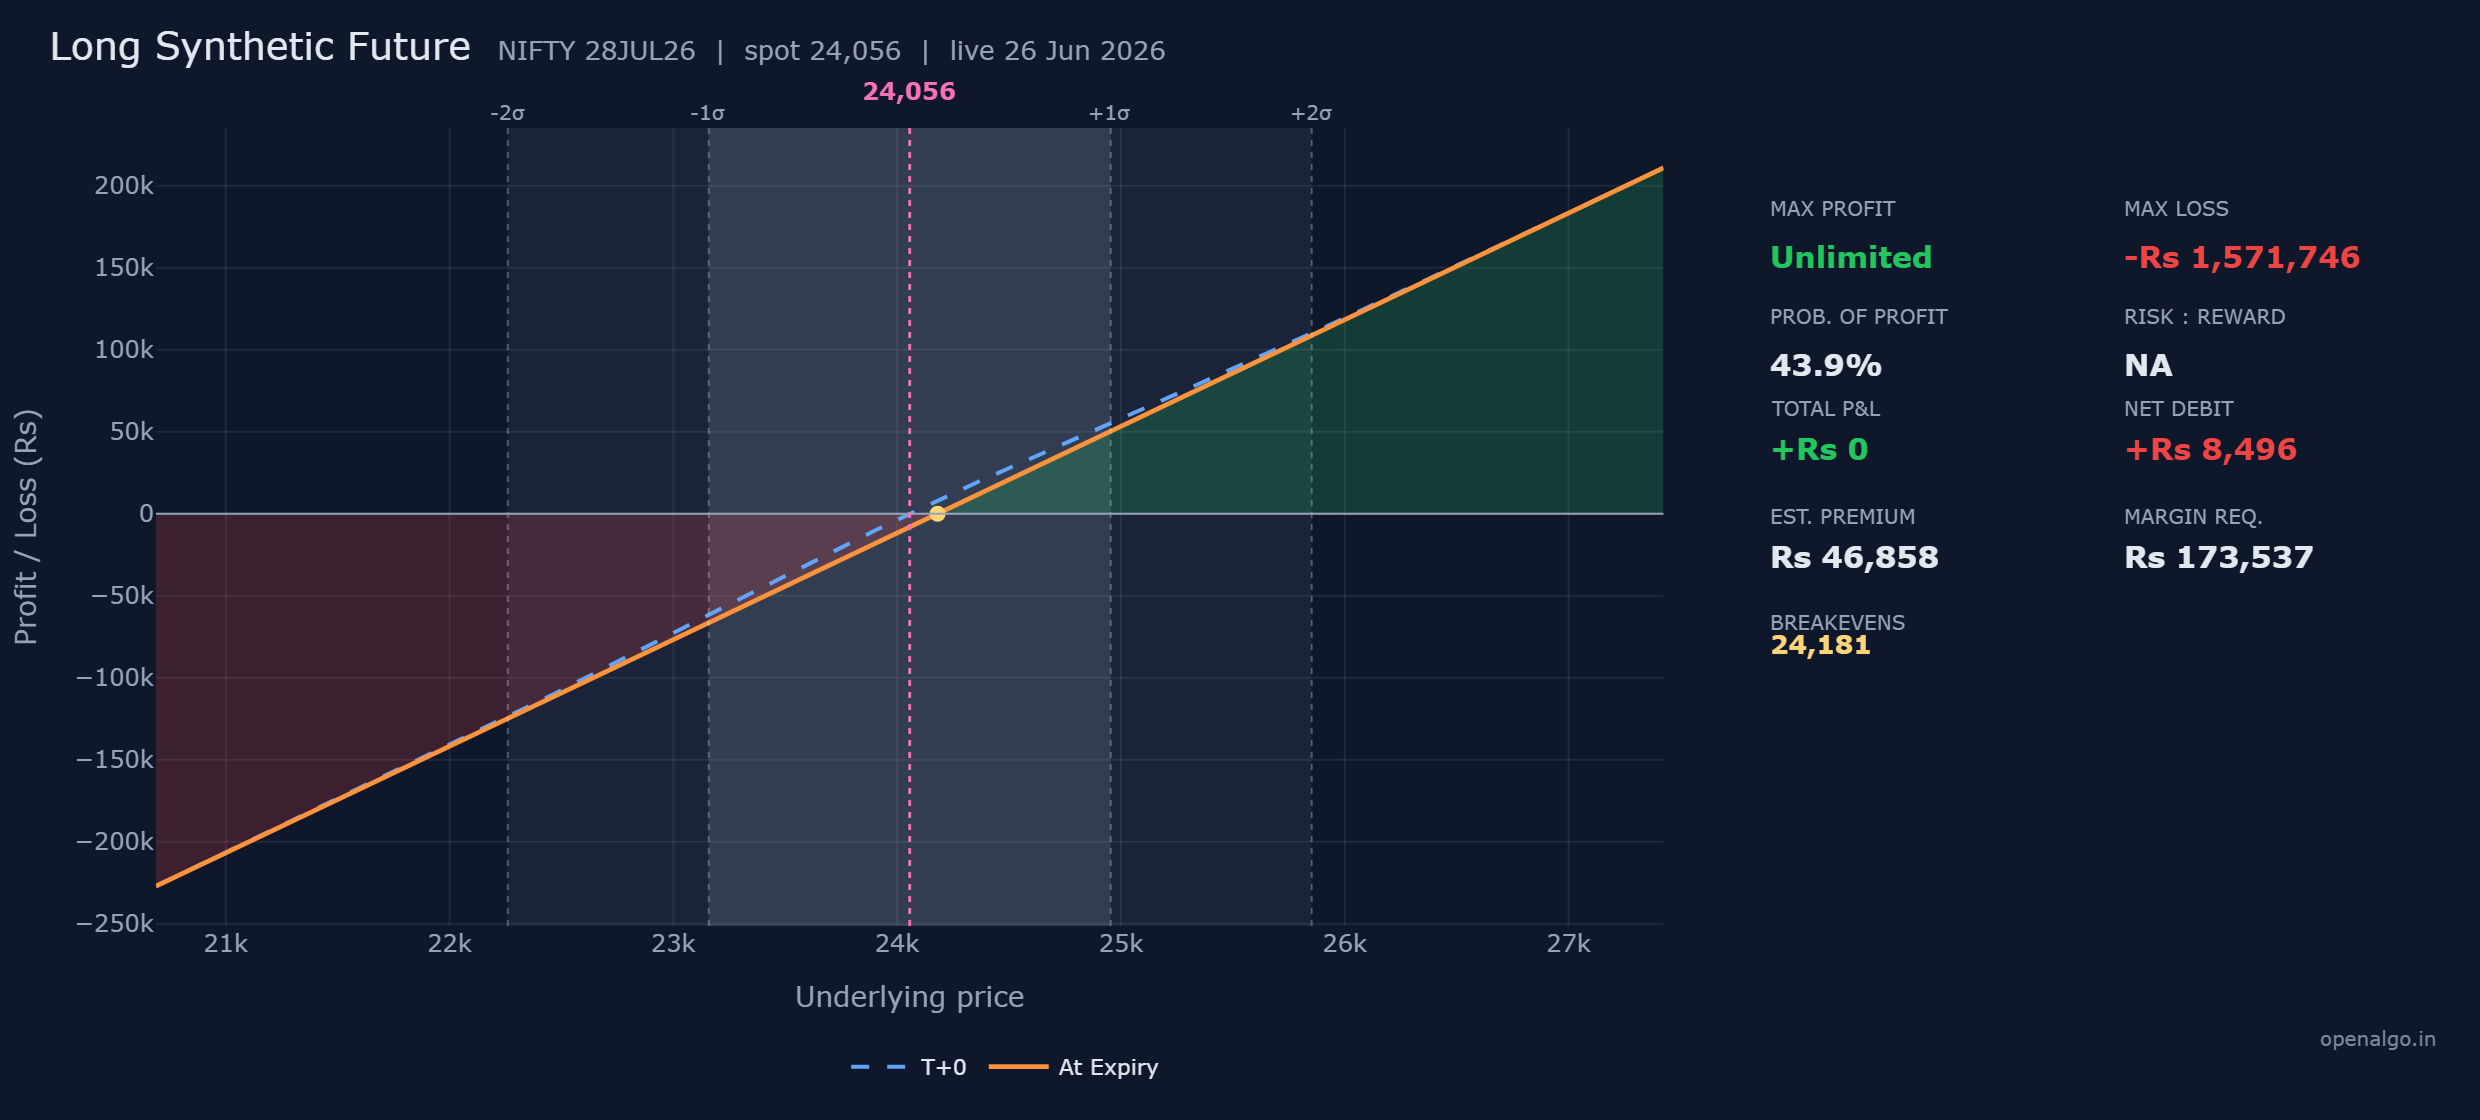
Strategy two: the long synthetic future
The next structure abandons curves entirely. By combining one bought call and one sold put at the same strike, you build a straight diagonal line that rises and falls exactly like owning a NIFTY future.
| Leg | Action | Strike | Premium per share | Cash flow per lot of 65 |
|---|---|---|---|---|
| 1 | Buy call | 24,050 | 425.8 paid | Rs 27,677 out |
| 2 | Sell put | 24,050 | 295.1 received | plus Rs 19,182 in |
| Net debit | Rs 8,496 out |
The bought call hands you all the upside of a future; the sold put hands you all of its downside. Together they cost a small net debit of Rs 8,496, and the position then tracks NIFTY point for point in both directions. There is no protective leg anywhere, so there is no flat floor. This is a whole future, rebuilt from two options.
Maximum profit is unlimited above the breakeven. Maximum loss runs toward zero, about Rs 1,571,746, because below the breakeven the position falls rupee for rupee just like a long future. Breakeven is 24,181, the strike plus the net debit per share of 130.7, which is the effective price at which you bought NIFTY.
| Number | How it is built | This trade |
|---|---|---|
| Max profit | future-like, no ceiling above breakeven | Unlimited |
| Max loss | future-like fall toward zero | about Rs 1,571,746 |
| Breakeven | strike plus net debit per share | 24,050 plus 130.7 equals 24,181 |
| NIFTY at expiry | 24,050 call bought | 24,050 put sold | Net profit or loss |
|---|---|---|---|
| 23,000 | worth 0 | worth 1,050 | minus Rs 76,746 (and falling) |
| 24,050 | worth 0 | worth 0 | minus Rs 8,496 |
| 24,181 | worth 131 | worth 0 | about Rs 0 (breakeven) |
| 24,500 | worth 450 | worth 0 | plus Rs 20,755 |
| 25,000 | worth 950 | worth 0 | plus Rs 53,255 (and rising) |
There is nothing to interpret in the line, which is the point. Above 24,181 you gain point for point with no ceiling; below it you lose point for point with no floor.
The long synthetic future behaves exactly like a long NIFTY future, so its risk is two-sided and enormous. The maximum loss is about Rs 1,571,746 if NIFTY collapses, the sold put is a naked short leg, and the exchange blocks a heavy margin near Rs 173,537. There is no defined floor here. This is a futures-grade position dressed as two options, and a beginner should treat it with futures-grade respect, never as if it were safer than a future.
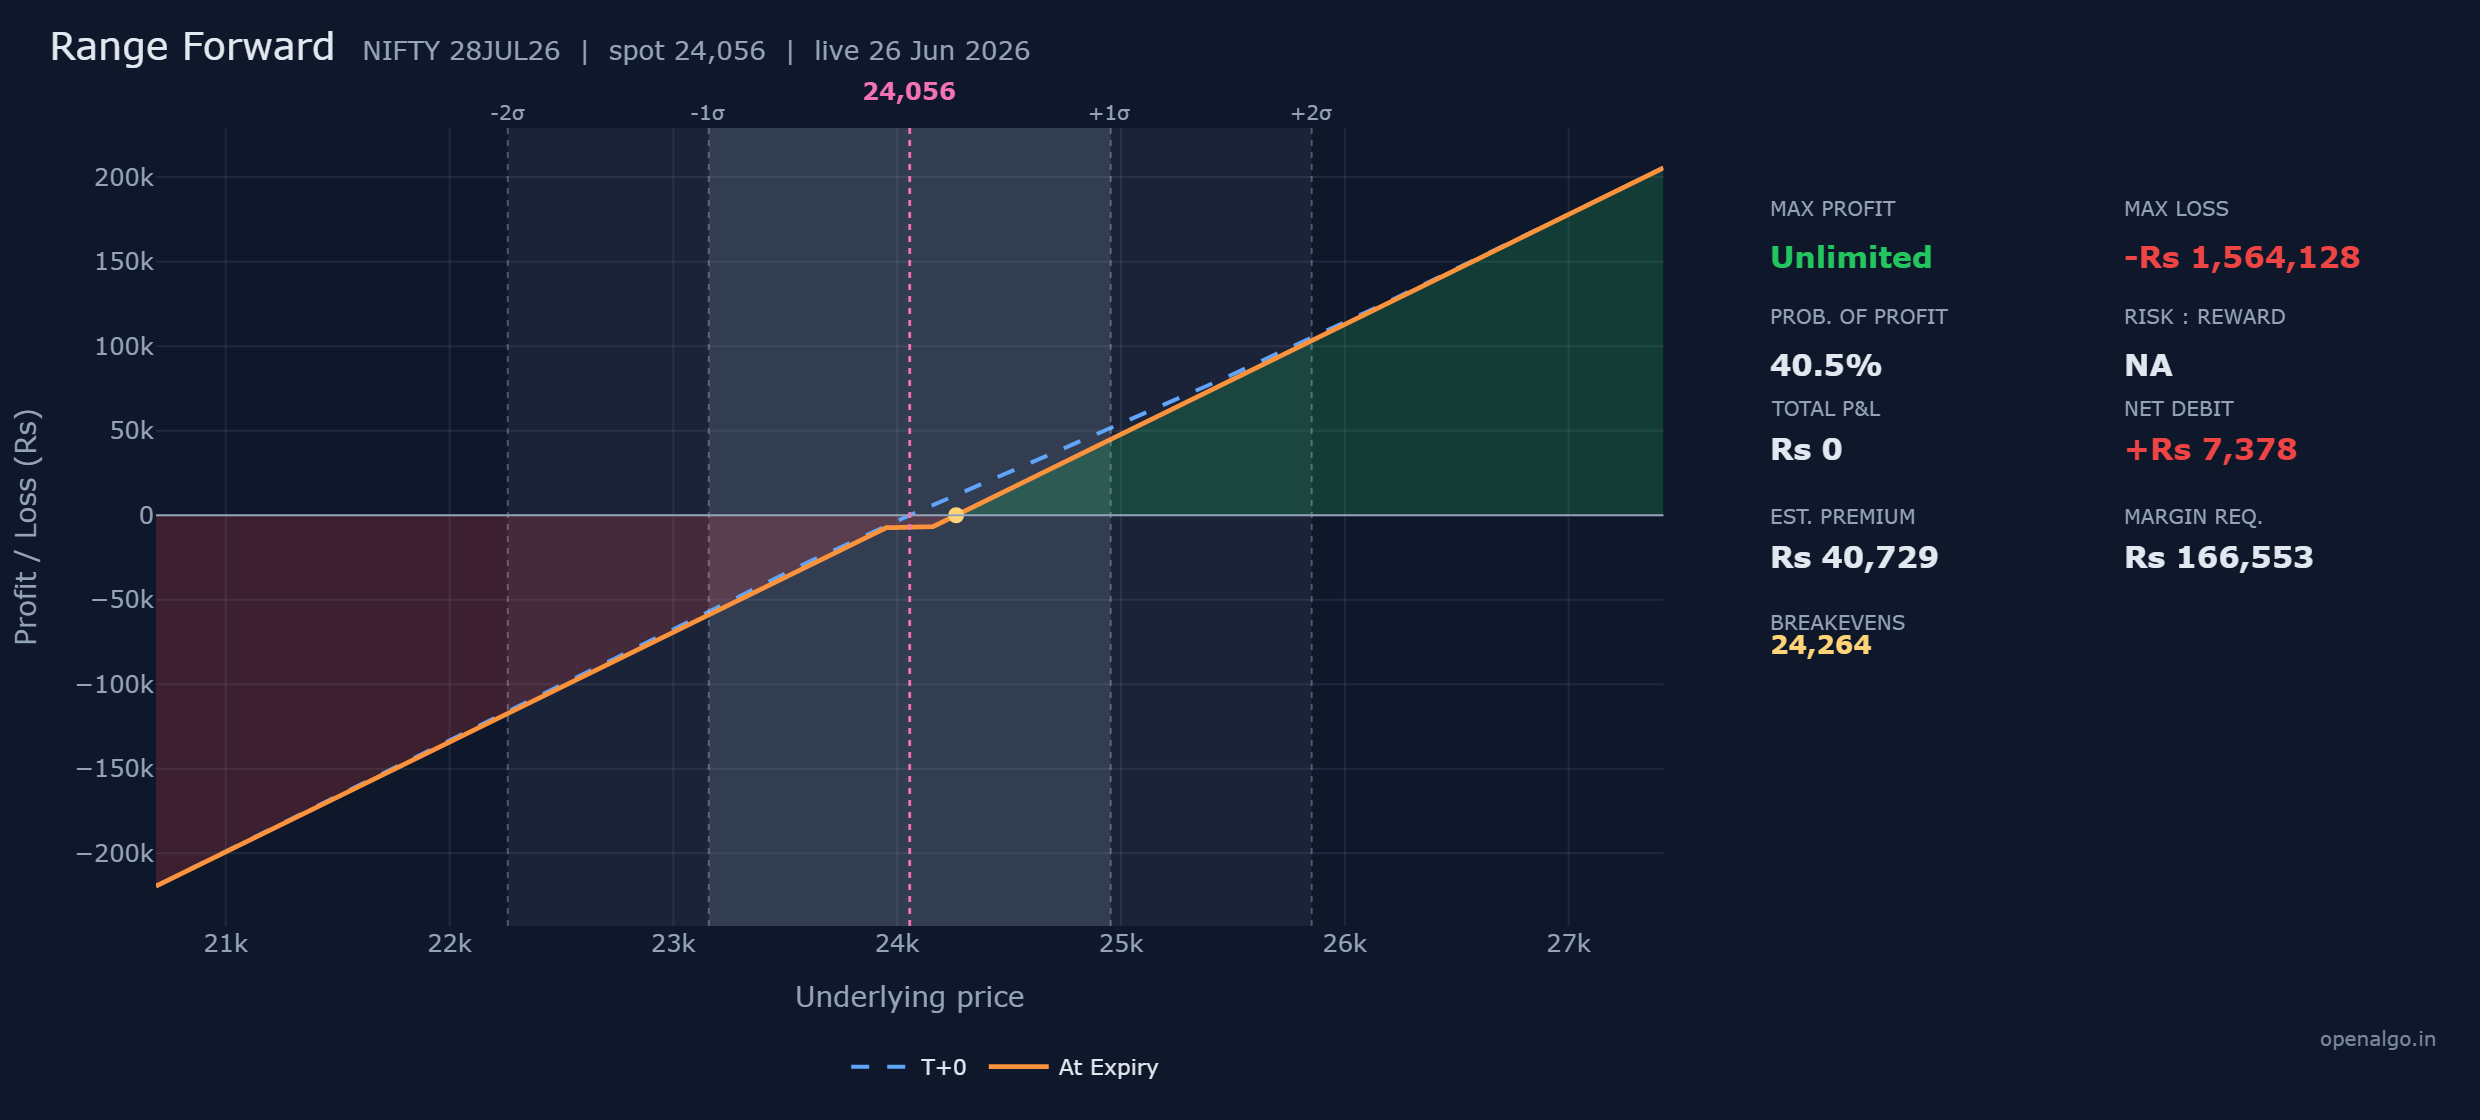
Strategy three: the range forward
The third structure is gentler. A range forward, sometimes called a bullish collar, sells an out-of-the-money put below the market to fund an out-of-the-money call above it.
| Leg | Action | Strike | Premium per share | Cash flow per lot of 65 |
|---|---|---|---|---|
| 1 | Sell put | 23,950 | 256.6 received | plus Rs 16,679 in |
| 2 | Buy call | 24,150 | 370.1 paid | Rs 24,057 out |
| Net debit | Rs 7,378 out |
The sold put pays for most of the bought call, leaving a small net debit of Rs 7,378. Between the two strikes, from 23,950 to 24,150, neither option has intrinsic value, so the position rests on that small debit, a flat dead zone where little happens. Outside the strikes it springs to life: above 24,150 the bought call gives unlimited upside, below 23,950 the sold put hands you a future-like downside.
Maximum profit is unlimited above the breakeven. Maximum loss runs toward zero, about Rs 1,564,128, on the naked put. Breakeven is 24,264, the upper strike of 24,150 plus the net debit per share of 113.5.
| Number | How it is built | This trade |
|---|---|---|
| Max profit | bought call running free above the upper strike | Unlimited |
| Max loss | sold put falling toward zero | about Rs 1,564,128 |
| Breakeven | upper strike plus net debit per share | 24,150 plus 113.5 equals 24,264 |
| NIFTY at expiry | 23,950 put sold | 24,150 call bought | Net profit or loss |
|---|---|---|---|
| 23,000 | worth 950 | worth 0 | minus Rs 69,128 (and falling) |
| 24,000 | worth 0 | worth 0 | minus Rs 7,378 (the dead zone) |
| 24,264 | worth 0 | worth 114 | about Rs 0 (breakeven) |
| 24,600 | worth 0 | worth 450 | plus Rs 21,873 |
| 25,100 | worth 0 | worth 950 | plus Rs 54,373 (and rising) |
The dead zone between the strikes makes the trade feel calm, but that calm ends the instant NIFTY drops through 23,950, where the sold put begins losing rupee for rupee with no floor.
The range forward erases its cost by selling a naked put, so the downside is future-like and very large, a maximum loss near Rs 1,564,128, with margin near Rs 166,553. Treat that downside exactly as you would a short put. The flat middle invites complacency, but a real fall through the lower strike behaves like a short future, not a defined-risk spread.
Your odds across the three
The probability of profit ranks these cleanly: about 28 percent for the call ratio back spread, 44 percent for the synthetic future, and 40 percent for the range forward. The back spread sits lowest because NIFTY must clear 24,564, beyond the plus one sigma band on its chart, before the open-ended upside pays. The synthetic and the range forward are close to even because they behave like a future, profiting on any move past a breakeven only a little above spot.
A low POP is not automatically a bad trade, and a higher one is not automatically good. The call ratio back spread wins only 28 percent of the time, yet its loss is capped at Rs 26,930 and its wins can be open-ended. The synthetic's 44 percent looks better until you set it beside its Rs 1,571,746 tail. Always read the POP next to the maximum loss, never on its own.
Margin
Margin sorts these three by danger more honestly than any other number. The call ratio back spread ties up about Rs 52,256, modest, because its loss is defined and the long calls largely cover the short. The long synthetic future blocks about Rs 173,537 and the range forward about Rs 166,553, both heavy, because each carries a naked short leg with an open downside the exchange must cover.
Return on margin only makes sense when the profit is capped, and two of these have no ceiling, so there is no fixed yield to quote. The takeaway is the contrast itself: roughly Rs 52,000 of margin for a defined-risk shape, against roughly Rs 1.7 lakh for a future in disguise.
Time decay
The three sit differently against the clock. The call ratio back spread is a net buyer of options, long one extra call, so time decay works gently against it: its blue T+0 line floats above the orange expiry line, and the valley deepens slightly as 28 July nears. The long synthetic future holds almost no time value at all, so its T+0 line lies right on the expiry line; it is essentially time-neutral, like a future. The range forward sits close to neutral too, with only a small bleed on its long call. None of these is a decay trade. They live or die by direction.
Three shapes, one bullish family
| Strategy | Max loss | Max profit | Breakeven | Margin |
|---|---|---|---|---|
| Call ratio back spread | Rs 26,930 | Unlimited | 24,564 | Rs 52,256 |
| Long synthetic future | about Rs 1,571,746 | Unlimited | 24,181 | Rs 173,537 |
| Range forward | about Rs 1,564,128 | Unlimited | 24,264 | Rs 166,553 |
Read the maximum loss column carefully, because it sorts these by danger. The call ratio back spread is the only one a beginner should reach for: its worst case is a defined Rs 26,930 and it asks for modest margin. The synthetic future and the range forward each carry a naked short leg, a downside well over fifteen lakh, and heavy margin, because each is really a future wearing an options costume.
Key takeaways
- All three are bullish with an unlimited upside, but they differ entirely in what they risk to reach it.
- The call ratio back spread has a defined max loss of Rs 26,930 that sits in the middle at the 24,150 strike, not in the tails, and runs free above the breakeven of 24,564. It is the beginner-safe choice here.
- The long synthetic future equals a long NIFTY future: breakeven 24,181, a near six-figure-times-ten downside toward Rs 1,571,746, heavy margin, and almost no time decay.
- The range forward is a bullish collar with a flat dead zone between the strikes, but the sold put leaves a future-like downside near Rs 1,564,128 below 23,950.
- Margin tells the truth: about Rs 52,000 for the defined-risk back spread, against roughly Rs 1.7 lakh for the two future-like structures.
- Always check which side of the chart hides the unlimited, or near unlimited, loss before being drawn in by the unlimited profit.