Position Greeks and the Volatility Regime
A spread is more than its payoff picture. It carries a net delta, gamma, theta and vega, and it lives inside a volatility regime. Learn to read the aggregate Greeks of a whole position, judge whether implied volatility is rich or cheap with IV rank, read the skew and the term structure, and choose credit, debit or calendar structures that fit the regime you are actually in.
- ·Aggregate position delta and gamma
- ·Net theta and vega
- ·IV rank and percentile
- ·Reading the skew
- ·The volatility term structure
- ·Credit, debit or calendar by regime
A payoff chart tells you where a trade ends at expiry. It does not tell you how the trade will feel on the way there, whether it gains or bleeds on a quiet day, or what happens to it if the mood of the market shifts. For that you need two more lenses. The first is the set of net Greeks, the small numbers that describe how your position breathes from one day to the next. The second is the volatility regime, the simple but powerful question of whether options right now are expensive or cheap relative to their own past. This chapter is the analytical bridge into choosing a strategy. Once you can read a position's net Greeks and place the current implied volatility on its own history, the right structure stops being a guess and starts being a decision.
A position is the sum of its legs
Every multi-leg strategy you have met is built from single options, and each single option has its own Greeks. The beautiful, simplifying fact is that the Greeks add up. To find what the whole position does, you add the same Greek across every leg, respecting the sign of each leg. A bought leg adds its Greek; a sold leg subtracts it. The four that matter are delta, gamma, theta and vega.
A strategy is just the sum of its legs, and so are its Greeks. Add the legs and you get the position's net delta, net gamma, net theta and net vega. Those four numbers tell you everything the static payoff chart leaves out: which way it leans, how quickly that lean changes, whether time is paying you or charging you, and whether you are betting for or against a change in implied volatility.
Reading the four net Greeks
Take a concrete trade on our anchor: NIFTY spot near 24,056, the at-the-money strike at 24,050, the 28 July 2026 expiry about 32 days out, lot size 65. Sell the 24,050 call and the 24,050 put together and you have a short straddle, collecting a credit of Rs 46,858 per lot. Walk its four net Greeks one at a time, because they describe almost every premium-selling position you will ever run.
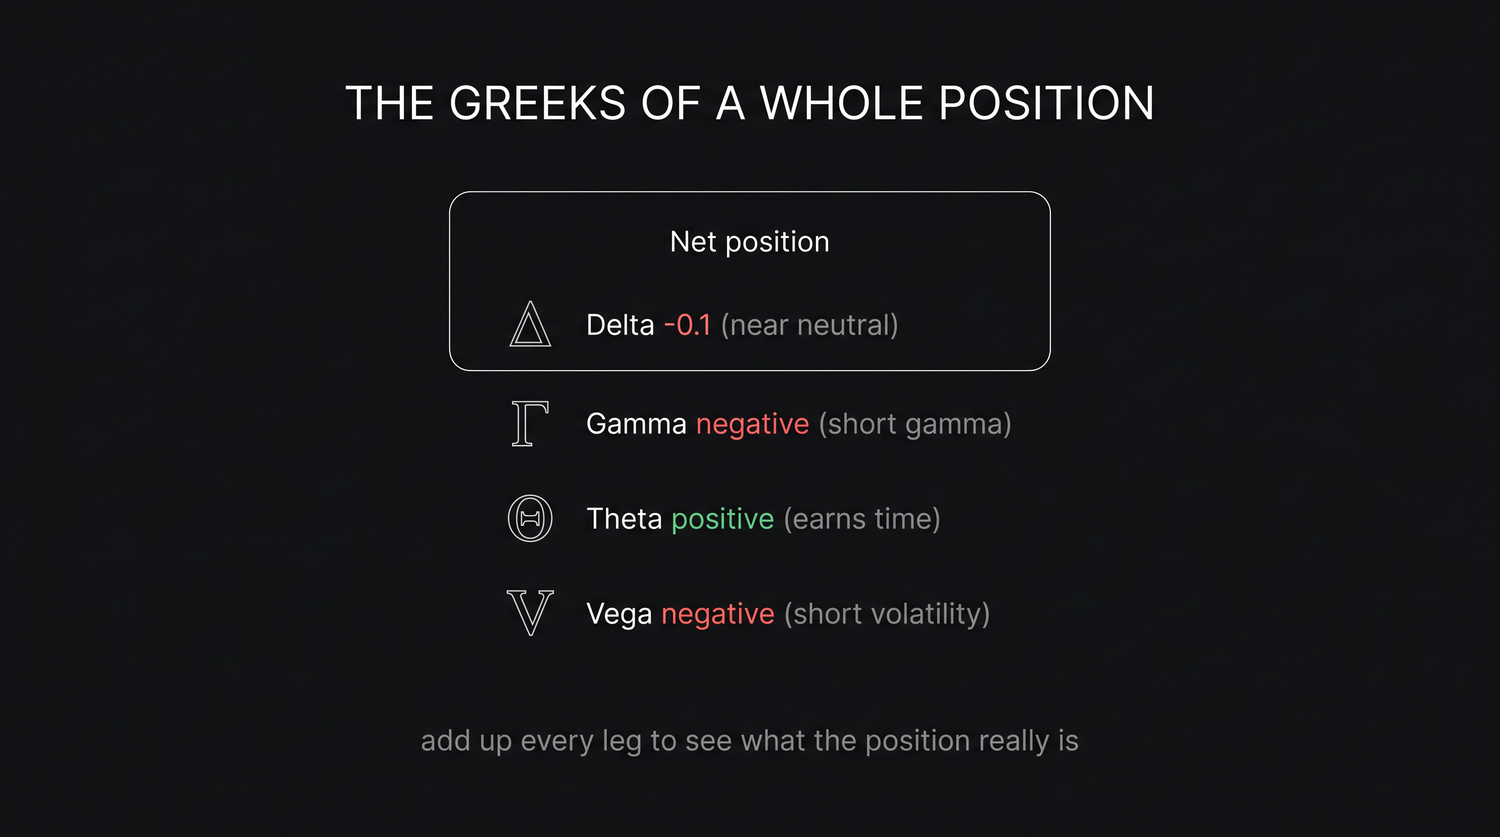
Net delta is the directional exposure, how much the position gains or loses for a one-point move in NIFTY. The short call carries negative delta, the short put carries positive delta, and at the money they very nearly cancel. The short straddle is therefore near delta-neutral: a small wobble up or down barely moves your profit and loss. A bull call spread, by contrast, would show clearly positive net delta, because it wants the index to rise. Net delta in plain words is the question, which way am I leaning, and by how much.
Net gamma is how fast that delta changes as NIFTY moves. The short straddle is short gamma, meaning its delta turns against it: as the index rises the position grows short, as it falls the position grows long, so every move hurts a little more than the last. Short gamma is the price every premium seller pays for a steady income. Long options are the opposite, long gamma, where moves help you more and more.
Net theta is the rupees that time decay hands you or takes from you each day, all else held still. The short straddle is positive theta: you are a net seller, so each passing day peels time value off the options you are short and that erosion is your income. A net buyer, such as a long straddle, has negative theta and pays that rent every day. Theta in plain words is, is the clock my friend or my enemy.
Net vega is the exposure to a change in implied volatility, the gain or loss if the market's expected range widens or narrows. The short straddle is short vega: if implied volatility falls, the options you sold get cheaper to buy back and you profit; if it spikes, they get dearer and you lose, even before NIFTY has moved a single point. Vega in plain words is, am I selling fear or buying it.
A short straddle and a four-legged credit iron condor on NIFTY share the same Greek signature: near delta-neutral, short gamma, positive theta, short vega. That single phrase tells the whole story. They make money slowly from time decay and from calm, they lose if the index makes a large move or if implied volatility jumps, and they do not much care which direction NIFTY drifts as long as it does not drift far.
The short straddle used here as a teaching example carries a loss with no ceiling on the upside and a very large but bounded loss on the downside, with breakevens at 23,329 and 24,771 around its Rs 46,858 credit. Its positive theta and short vega are attractive, but the unlimited risk is real. A beginner who wants the same short-gamma, short-vega, positive-theta profile should express it with a defined-risk structure such as the credit iron condor (max profit Rs 5,616, max loss capped at Rs 884), which keeps the worst case a known number.
Implied volatility is a regime, not a number
Net vega only matters if you know which way implied volatility is likely to go, and that is not something you read off a single quote. Today's at-the-money implied volatility on NIFTY is about 12.7 percent, but 12.7 is meaningless on its own. The right question is always, high or low compared to what? Implied volatility is a regime, and you judge it against its own recent history.
Two simple measures place it on that history. IV rank asks where current implied volatility sits between its lowest and highest readings over the past year, as a percentage of that range. If the past year ran from 10 to 22 percent and today is 12.7, the rank is low, because 12.7 sits near the bottom of the band. IV percentile asks a slightly different question: on what fraction of the past year's days was implied volatility lower than it is today. A percentile of 20 means it was cheaper only one day in five, so today is on the calm side. Rank cares about the extremes of the range, percentile cares about how often you have been here, and together they tell you whether premium is rich or cheap right now.
At the index level you do not even have to compute this yourself. India VIX is the market's published read on the expected thirty-day volatility of NIFTY, derived from the whole option chain. A low and falling India VIX says the option market is pricing calm, which is the environment where sold premium decays quietly. A high and rising India VIX says fear is being priced in, premiums are fat, and selling them is both more rewarding and more dangerous.
Before you place any volatility trade, glance at IV rank, IV percentile and India VIX together. They answer one question that decides whether you should be a seller or a buyer of options: is implied volatility expensive or cheap relative to its own past? That single read is worth more than any view on direction when you are choosing between a credit and a debit structure.
The skew: puts cost more than equidistant calls
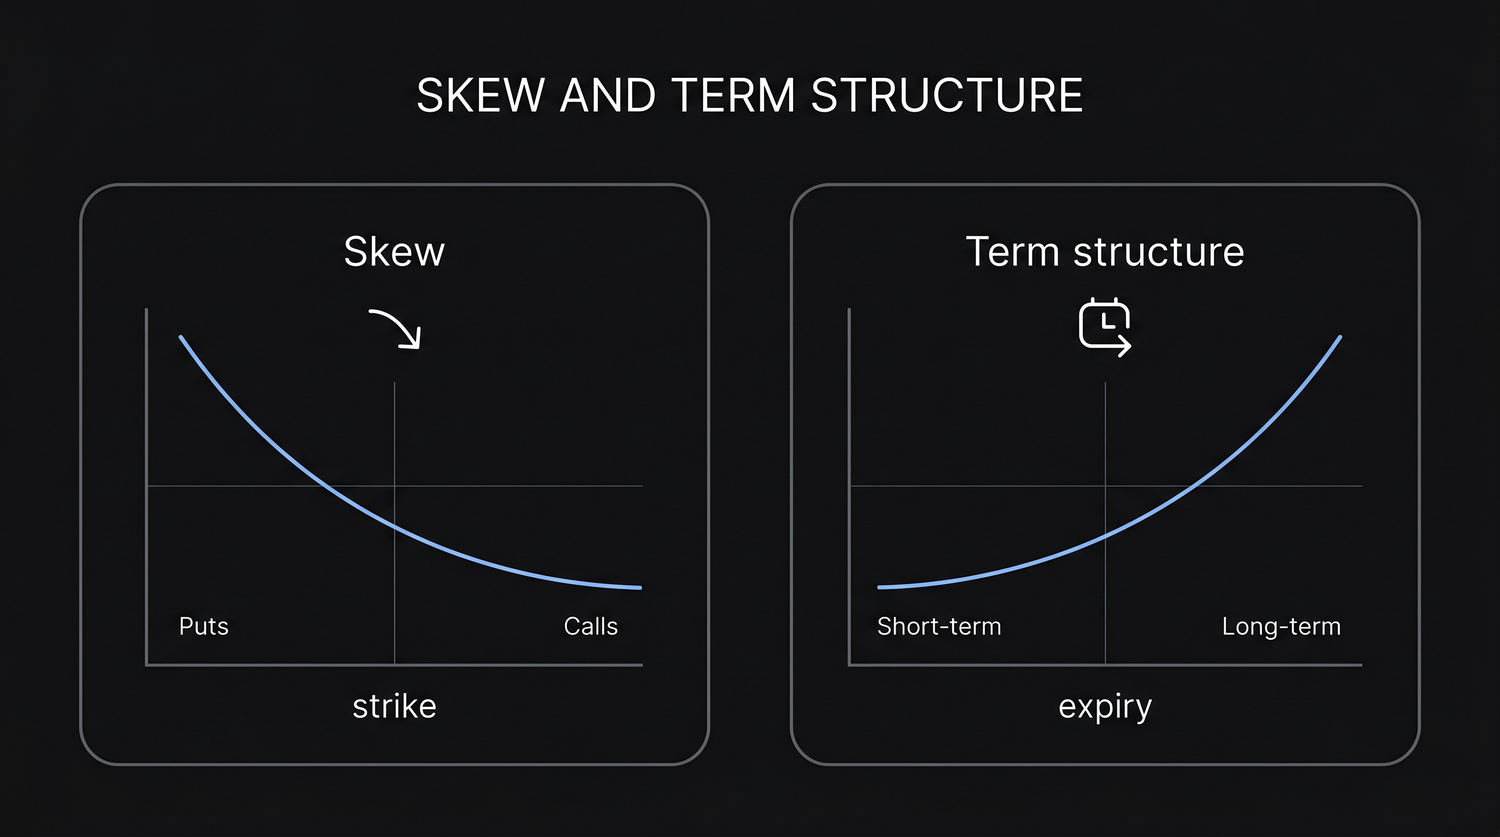
Implied volatility is not even uniform across strikes on the same expiry. On index options the downside almost always trades at a higher implied volatility than the upside. A put a given distance below the money carries a richer implied volatility than a call the same distance above it. This tilt is the volatility skew, and it exists because markets fall faster than they rise: investors pay up for downside protection, and that persistent demand lifts the implied volatility of lower strikes.
The skew matters the moment you pick strikes. When you sell the put side of an iron condor or a bull put spread on NIFTY, you are selling into that richer downside volatility, so the put wing tends to bring in more premium for the same distance from spot than the call wing does. It also means a symmetric-looking structure is rarely symmetric underneath: the downside strikes are priced for more fear than the upside ones. Reading the skew stops you from assuming both sides of a range trade are the same bet.
The term structure: near against far
The other dimension is time. Implied volatility differs not just across strikes but across expiries. Comparing the near 28 July 2026 expiry with the far 25 August 2026 expiry gives you the term structure. In calm markets it slopes gently upward, with the far month carrying slightly higher implied volatility than the near month, because more can happen over a longer horizon. That upward shape is the normal state.
An inverted term structure, where the near month is more expensive than the far, is a warning. It usually appears before a known event such as a result or a policy decision, when the market expects a burst of movement very soon and then a return to calm. The shape of the curve is information: an upward term structure says the near expiry is relatively cheap, an inverted one says the near expiry is loaded with event premium that will collapse once the event passes.
This is exactly what a calendar trade is built to harvest. Sell the near 28 July option and buy the far 25 August option at the same strike, and you are short the near-dated volatility and long the far-dated volatility, profiting if the near leg decays faster than the far leg, which is what an upward term structure and steady spot deliver.
Matching the structure to the regime
Now the two lenses meet. Read your position's net vega, then read the regime, and make sure they agree.
- When implied volatility is high (rich IV rank, elevated India VIX), premium is expensive, so favour selling it. Credit spreads, the credit iron condor, and short straddles or strangles are all short vega: they win if implied volatility falls back toward normal, which rich regimes tend to do. For beginners, keep this defined-risk, the iron condor rather than the naked straddle.
- When implied volatility is low (cheap IV rank, calm India VIX), premium is cheap, so favour buying it. Debit spreads and long options are long vega: they win if implied volatility rises from a low base, and they cost little when options are cheap to own.
- When the edge is in the shape of the curve rather than its level, use a calendar to trade the term structure, selling the dearer near-dated volatility and owning the cheaper far-dated volatility.
Sell high and buy low is a starting bias, not a rule. High implied volatility is only worth selling when the implied move is genuinely rich against the move you actually expect to be realised, and a high reading often reflects a real event ahead. Selling into an earnings result or a policy day can hand you a fat premium and a brutal gap on the same trade. So pair the regime read with an event check, keep the risk defined, and never sell premium just because the number is high.
The rule that ties it together is the sign of your net vega against the regime. Short vega wins if implied volatility falls, so it belongs in high-IV regimes. Long vega wins if implied volatility rises, so it belongs in low-IV regimes. Putting a short-vega trade on when implied volatility is already cheap, or a long-vega trade on when it is already expensive, is fighting the regime, and the regime usually wins.
The practical takeaway
Greeks and the volatility regime are not academic decorations; they are the pre-flight check that turns the rest of this course into decisions you can defend. The discipline is short and it never changes.
- Add the legs and read the net Greeks. Know your net delta (which way you lean), net gamma (how fast that lean changes), net theta (whether time pays you), and net vega (whether you are selling or buying volatility).
- Decide from the vega sign whether the position is a seller or a buyer of volatility, and never let that be an accident.
- Place the current implied volatility on its own history with IV rank, IV percentile and India VIX, so you know whether premium is rich or cheap.
- Check the skew before you choose strikes and the term structure before you choose expiries.
- Put it on only when the regime is on your side: sell premium when implied volatility is high, buy it when it is low, and trade calendars when the edge is in the curve. With that habit, the strategy you pick in the final chapter will already fit the market you are actually in.