Calendar and Diagonal Spreads: Trading Time
Strategies that sell a near expiry and buy a far one. Learn the call and put calendar and the diagonal, how the back-month leg keeps its time value to form a tent, and how they profit from time decay.
- ·Selling near, buying far
- ·The call and put calendar
- ·The diagonal spread
- ·The calendar tent shape
- ·Profiting from time decay
- ·Reading the live payoffs
Every strategy you have met so far makes a bet on direction or on the size of a move. Calendars are different. They bet on time itself. A calendar spread sells an option in the near expiry and buys the same kind of option in a later expiry, earning its money from one simple fact: the near-month option loses its time value faster than the far-month one. If NIFTY sits quietly near the strike while the front leg melts away, the back leg you still own keeps most of its worth, and the gap between the two is your profit. This chapter builds three of these time trades on real NIFTY option data captured on 26 June 2026, spot 24,056, lot 65, near expiry 28 July 2026 and far expiry 25 August 2026.
The one-line idea: sell the near, own the far
Time value does not drain out of an option evenly. It drains slowly when expiry is far away, then faster as the final days approach. A 28 July option and a 25 August option both hold time value today, but over the next month the July one loses almost all of it while the August one, with a fresh month still ahead, barely notices. A calendar harvests that difference. You sell the near-month leg and buy the far-month leg at the same strike, and because the back-month option always costs more, you pay a small net debit to put the trade on.
Now look at what the chart draws. The orange "At Expiry" line is plotted at the near expiry, the moment your sold July leg dies. If NIFTY sits near the strike on 28 July, the front leg expires worthless and you keep its premium, while the back leg you own still has a whole month of life and so holds a healthy slice of time value. The spread between a dead front leg and a living back leg is worth more than the debit you paid, and that surplus is your gain. Plot it across every closing price and you get a tent, a peak at the strike sloping down on both sides.
A calendar spread is long time. You collect the fast decay of the near-month option you sold and pay for the slow decay of the far-month option you own. It makes the most money when NIFTY finishes right at the strike on the near expiry, where the front leg dies worthless and the back leg keeps the most time value. Drift too far either way and both legs lose their time value together, the tent collapses, and you lose close to the debit you paid.
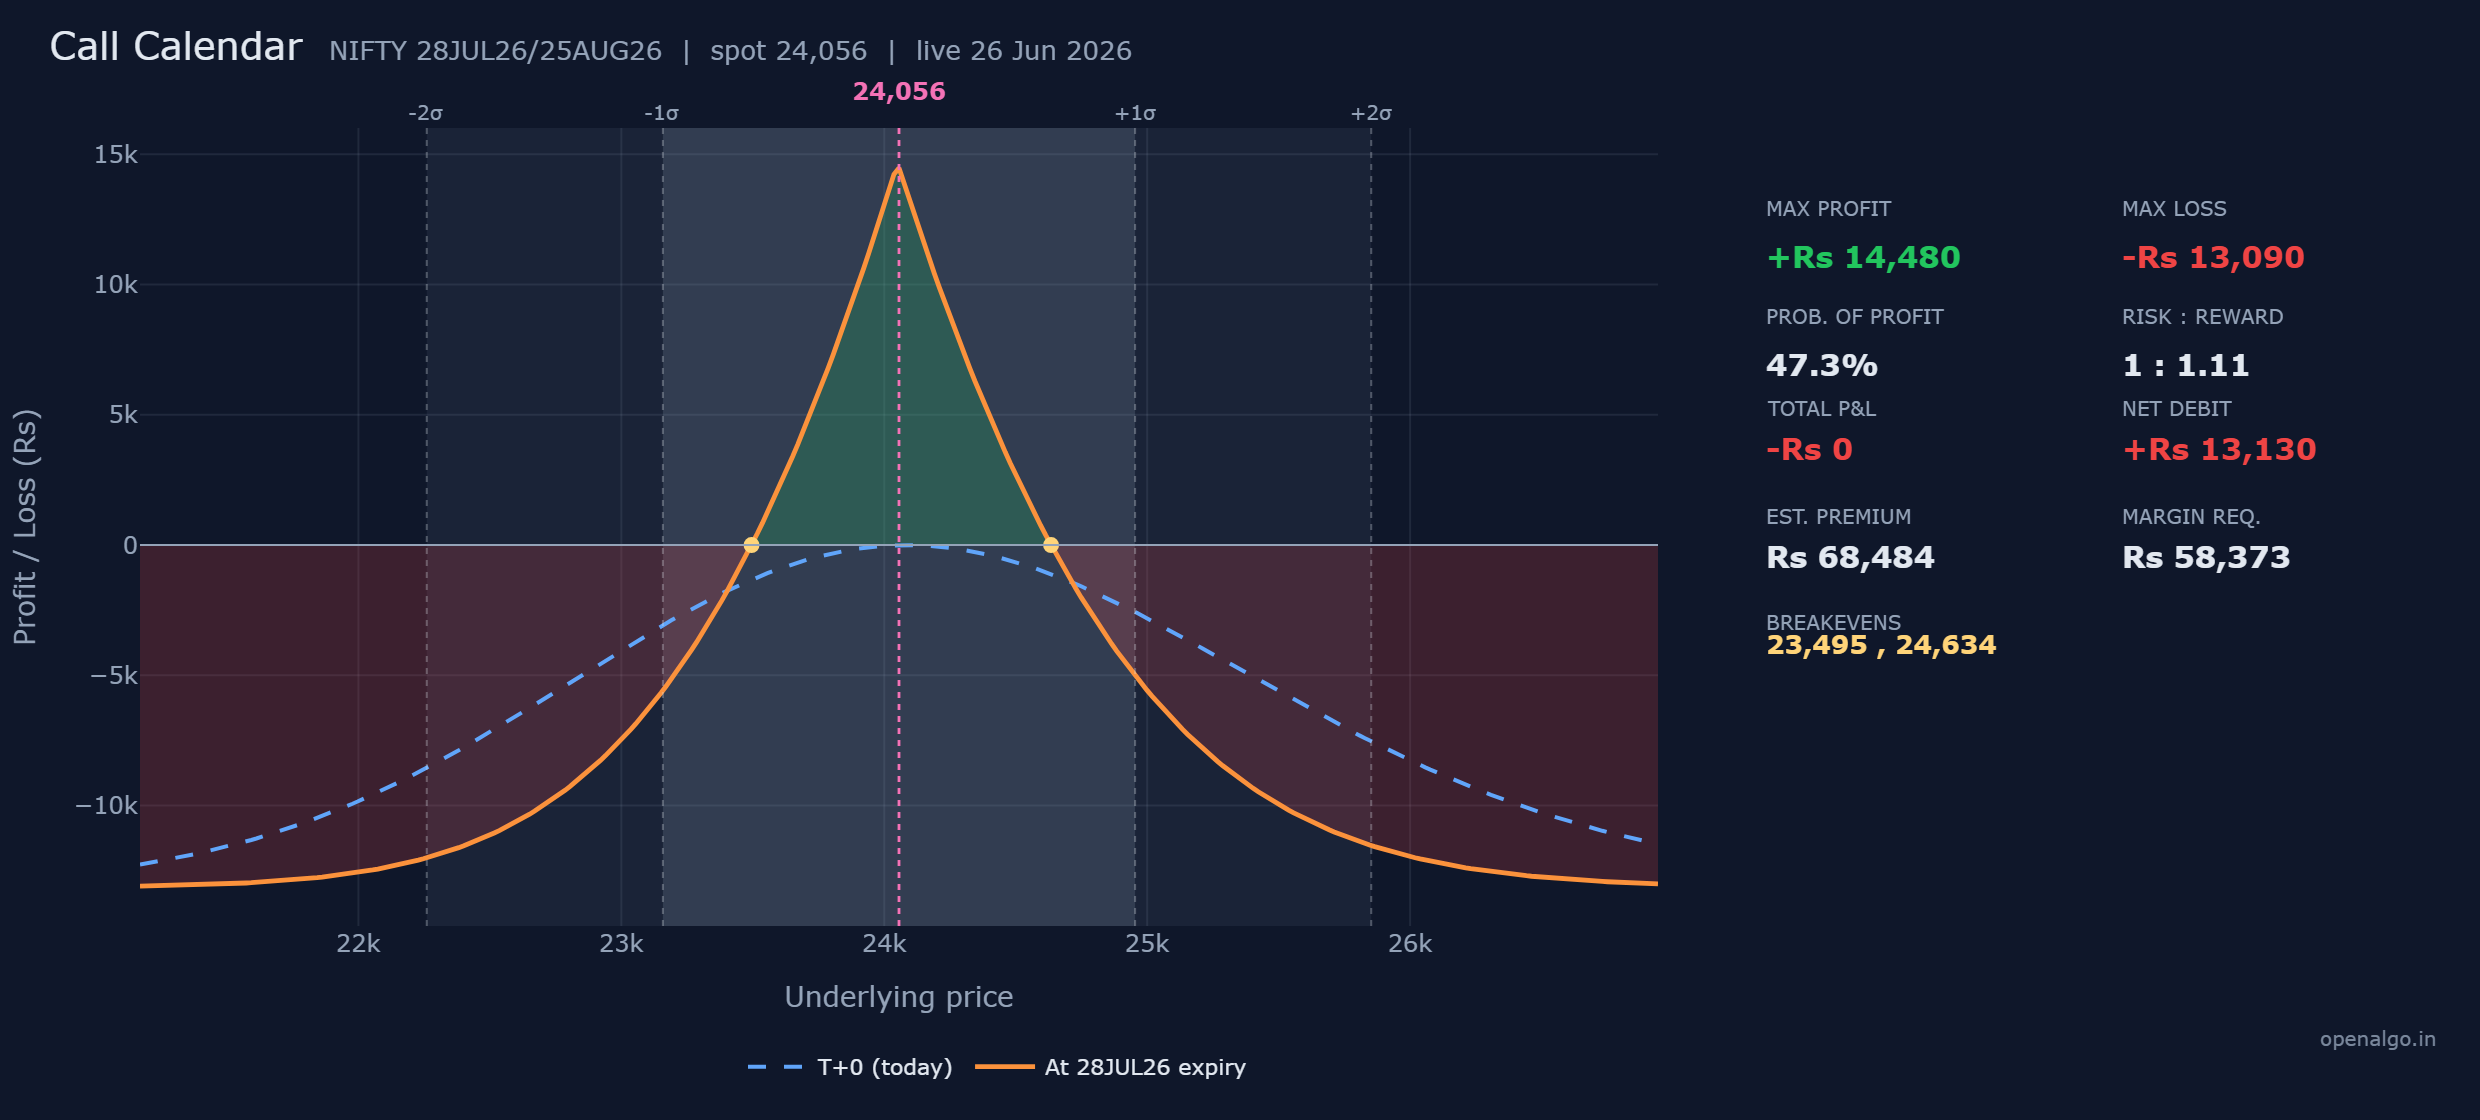
The call calendar, rupee by rupee
The plainest version uses two calls at the at-the-money strike.
| Leg | Action | Expiry | Strike | Premium per share | Cash flow per lot of 65 |
|---|---|---|---|---|---|
| 1 | Sell 1 | 28 Jul 2026 | 24,050 call | 425.8 received | plus Rs 27,677 in |
| 2 | Buy 1 | 25 Aug 2026 | 24,050 call | 627.8 paid | Rs 40,807 out |
| Net debit | Rs 13,130 out |
The far call costs more than the near call by 202 points per share, so you pay a net debit of Rs 13,130, which is 202 times 65 and your maximum stake.
The three numbers, and where they come from
Maximum profit is Rs 14,480, at the strike. When NIFTY finishes at 24,050 on 28 July, your sold July call expires worthless while your August call still carries a full month of time value. The surplus of that living back leg over the debit you paid is the peak, Rs 14,480.
Maximum loss is Rs 13,090, far from the strike. Push NIFTY a long way either direction and both calls lose almost all their time value, so the spread between two same-strike calls collapses toward zero and you lose close to the whole debit. It is Rs 13,090 rather than the full Rs 13,130 only because the back-month call never quite reaches zero value at the near expiry.
Breakevens are 23,495 and 24,634, the two prices where the tent crosses zero, framing the band inside which the calendar makes money.
| Number | How it is built | This trade |
|---|---|---|
| Max profit | back-month time value left, minus the debit | Rs 14,480 |
| Max loss | the debit, less a sliver of back-month value | Rs 13,090 |
| Breakevens | where the tent crosses zero, around the strike | 23,495 / 24,634 |
Walking the outcomes at the near expiry
Settle the call calendar at five closing prices on 28 July, per lot of 65. The sold July call settles at exact intrinsic value, but the August call you still own keeps a month of life, so its value here is modelled and approximate.
| NIFTY on 28 July | 24,050 call you sold | 24,050 call you still own (approx) | Net profit or loss |
|---|---|---|---|
| 23,200 | expires worthless | thin, little time value left | about minus Rs 13,090 (near max loss) |
| 23,495 | expires worthless | holds modest value | about Rs 0 (lower breakeven) |
| 24,050 | expires worthless | still rich, a month of life left | plus Rs 14,480 (max profit) |
| 24,634 | worth 584 against you | deeper, but the spread is thin | about Rs 0 (upper breakeven) |
| 25,100 | worth 1,050 against you | deep, little extra time value | about minus Rs 13,090 (near max loss) |
Read the tent in the table. Right at the strike you collect the full Rs 14,480, where the dead front leg and the living back leg are furthest apart. Slide away either direction and the gain shrinks to zero at the breakevens, then keeps falling toward the Rs 13,090 max loss as both calls lose their time value together. This scenario table is built at the near expiry, the moment the calendar is designed around.
Your odds, margin, and return
The call calendar's probability of profit is about 47 percent. Using NIFTY's roughly 12.7 percent implied volatility and the 32 days to the near expiry, the market gives the index a little under an even chance of finishing inside the 23,495 to 24,634 band by 28 July.
Because you own the far-month leg, a calendar is defined-risk and its margin is modest, about Rs 58,373, far below the lakhs a naked short would demand. Measured against that margin, the Rs 14,480 peak is a return of roughly 25 percent if the strike is pinned, a healthy one-month yield, though that best case needs NIFTY to finish right at 24,050.
A calendar wins by standing still, so judge it by how wide its profit band is against how far NIFTY tends to wander in a month. A 47 percent chance across a band of 23,495 to 24,634 tells you this trade wants a genuinely calm month. If you expect a move, a calendar is the wrong tool no matter how attractive the tent looks.
Time decay is the whole point
For every other debit trade in this course, time decay is the enemy. The calendar flips that. You are short the fast-decaying near-month option and long the slow-decaying far-month one, so each quiet day the front leg you sold loses value faster than the back leg you own, and the gap widens in your favour. The blue T+0 line sits below the orange tent near the strike, and as the near expiry approaches the position rises toward that orange peak. A calendar is the one structure here that is paid by the passing of time.
The put calendar
Swap both calls for puts at the same strike and you get the put calendar.
| Leg | Action | Expiry | Strike | Premium per share |
|---|---|---|---|---|
| 1 | Sell 1 | 28 Jul 2026 | 24,050 put | 295.1 received |
| 2 | Buy 1 | 25 Aug 2026 | 24,050 put | 384.6 paid |
| Net debit | Rs 5,818 out |
| Metric | Value |
|---|---|
| Max profit | Rs 11,236 |
| Max loss | Rs 5,817 |
| Breakevens | 23,570 / 24,548 |
| Probability of profit | about 42 percent |
| Risk to reward | 1 : 1.93 |
| Net debit | Rs 5,818 |
| Margin required | Rs 48,986 |
| Total P&L now | about Rs 0 |
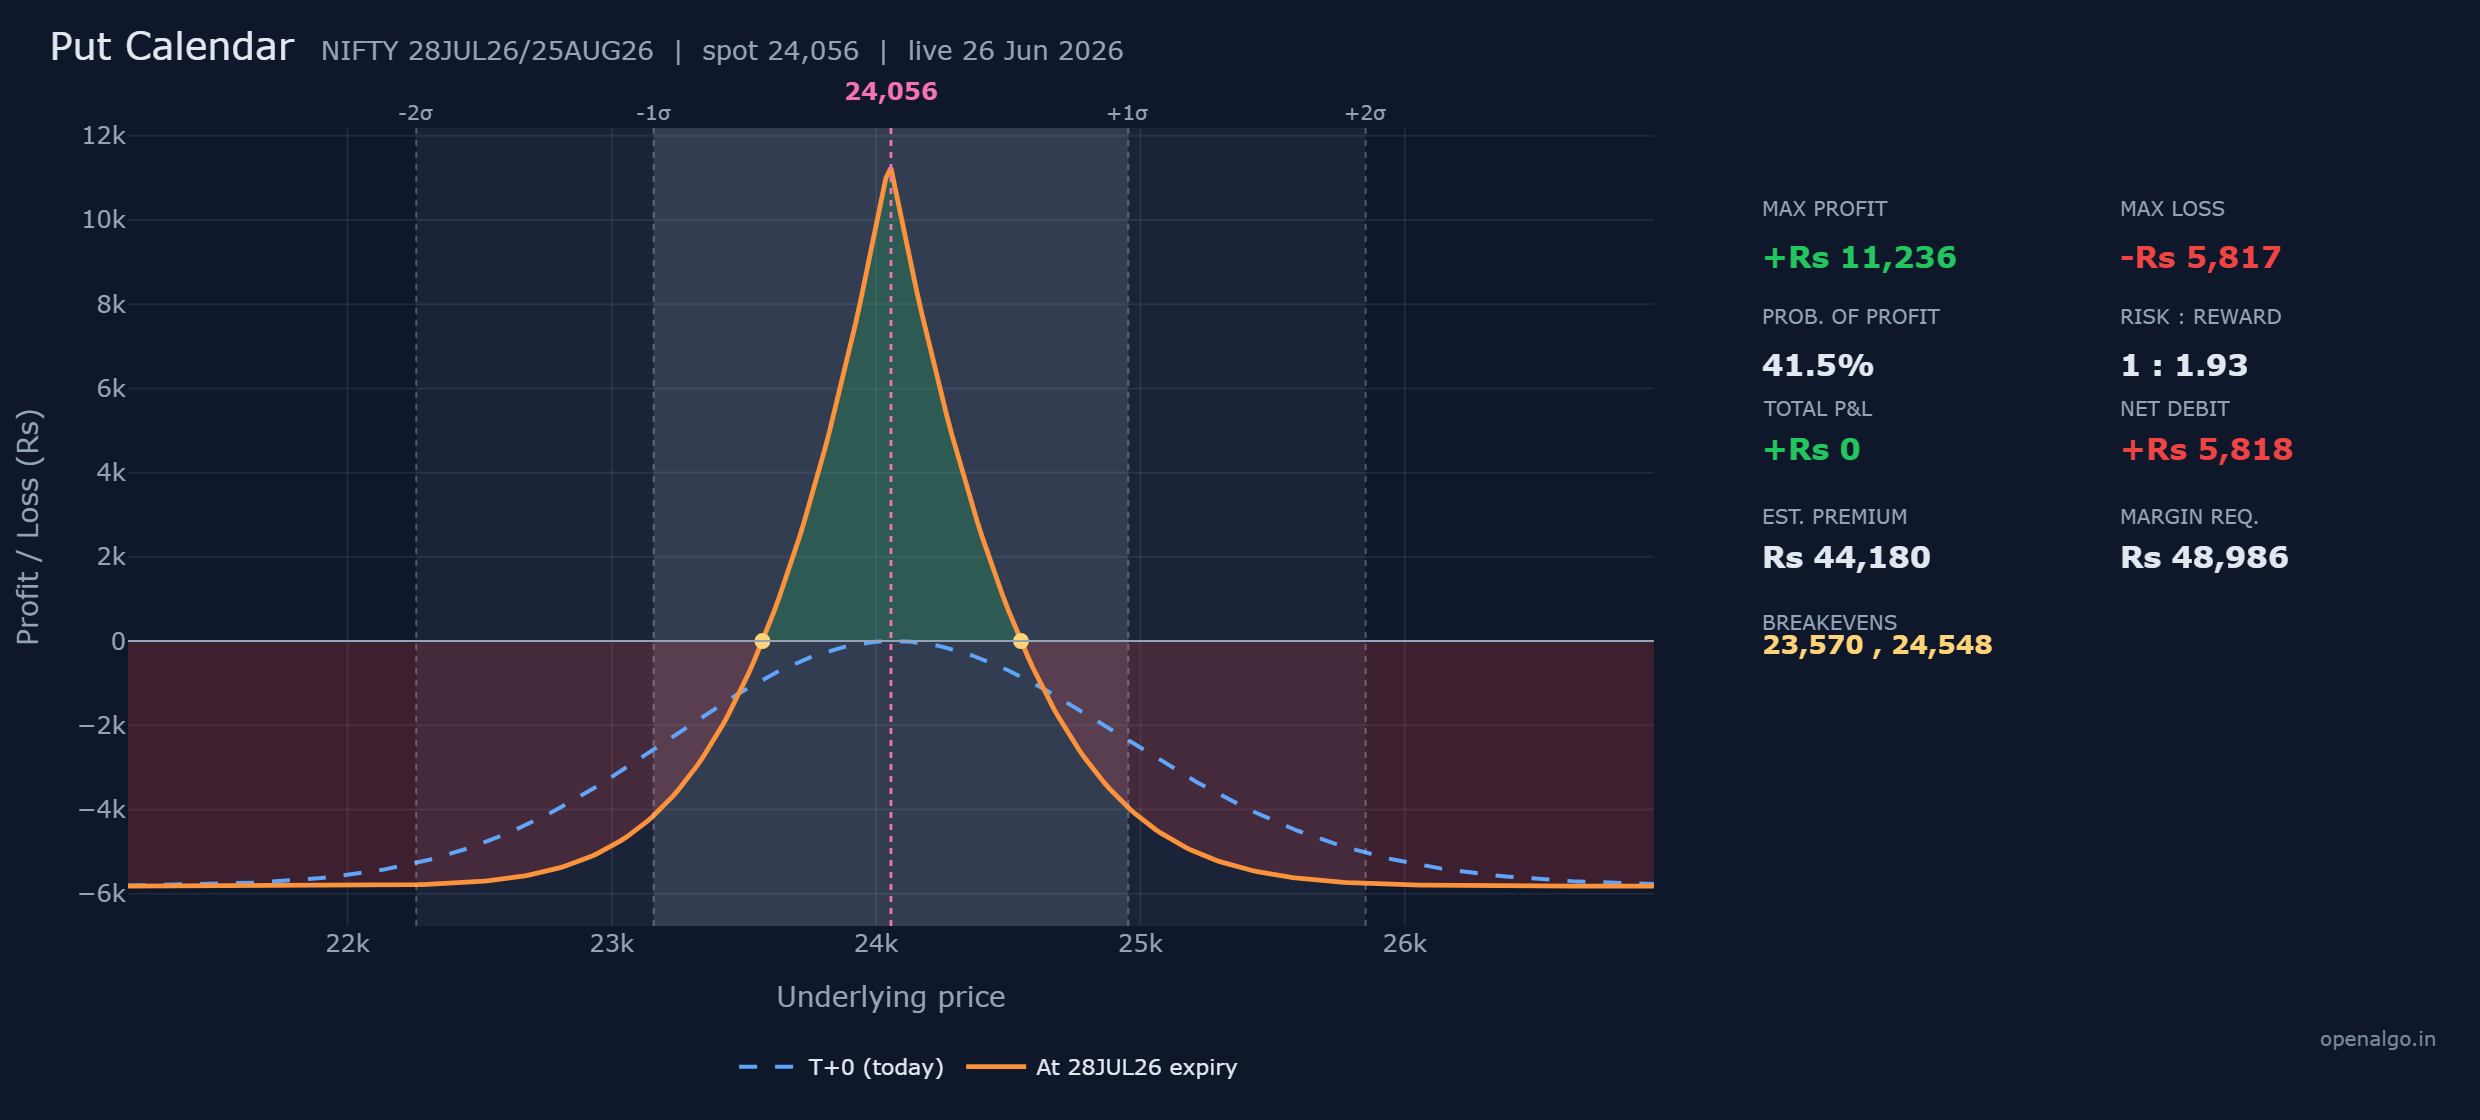
The shape is the same tent, but the numbers are kinder. On this snapshot the put calendar costs only Rs 5,818, far less than the call version, yet its maximum profit of Rs 11,236 is nearly as large. That is why its risk to reward is 1 to 1.93, the best of the three: you risk under six thousand to make over eleven. The breakevens, 23,570 and 24,548, frame a tent around the strike, and the maximum loss of Rs 5,817 is essentially the debit you paid.
The diagonal calendar
A diagonal calendar keeps the time element but adds a second twist: the two legs sit at different strikes as well as different expiries. You still sell the near month and buy the far month, but the strike gap tilts and widens the tent, giving it a directional lean instead of a symmetric peak.
| Leg | Action | Expiry | Strike | Premium per share |
|---|---|---|---|---|
| 1 | Sell 1 | 28 Jul 2026 | 24,050 call | 425.8 received |
| 2 | Buy 1 | 25 Aug 2026 | 24,150 call | 561.1 paid |
| Net debit | about Rs 8,791 out |
| Metric | Value |
|---|---|
| Max profit | Rs 14,881 |
| Max loss | Rs 15,161 |
| Breakevens | 23,382 / 24,593 |
| Probability of profit | about 50 percent |
| Risk to reward | 1 : 0.98 |
| Net debit | about Rs 8,791 |
| Margin required | Rs 55,782 |
| Total P&L now | about Rs 0 |
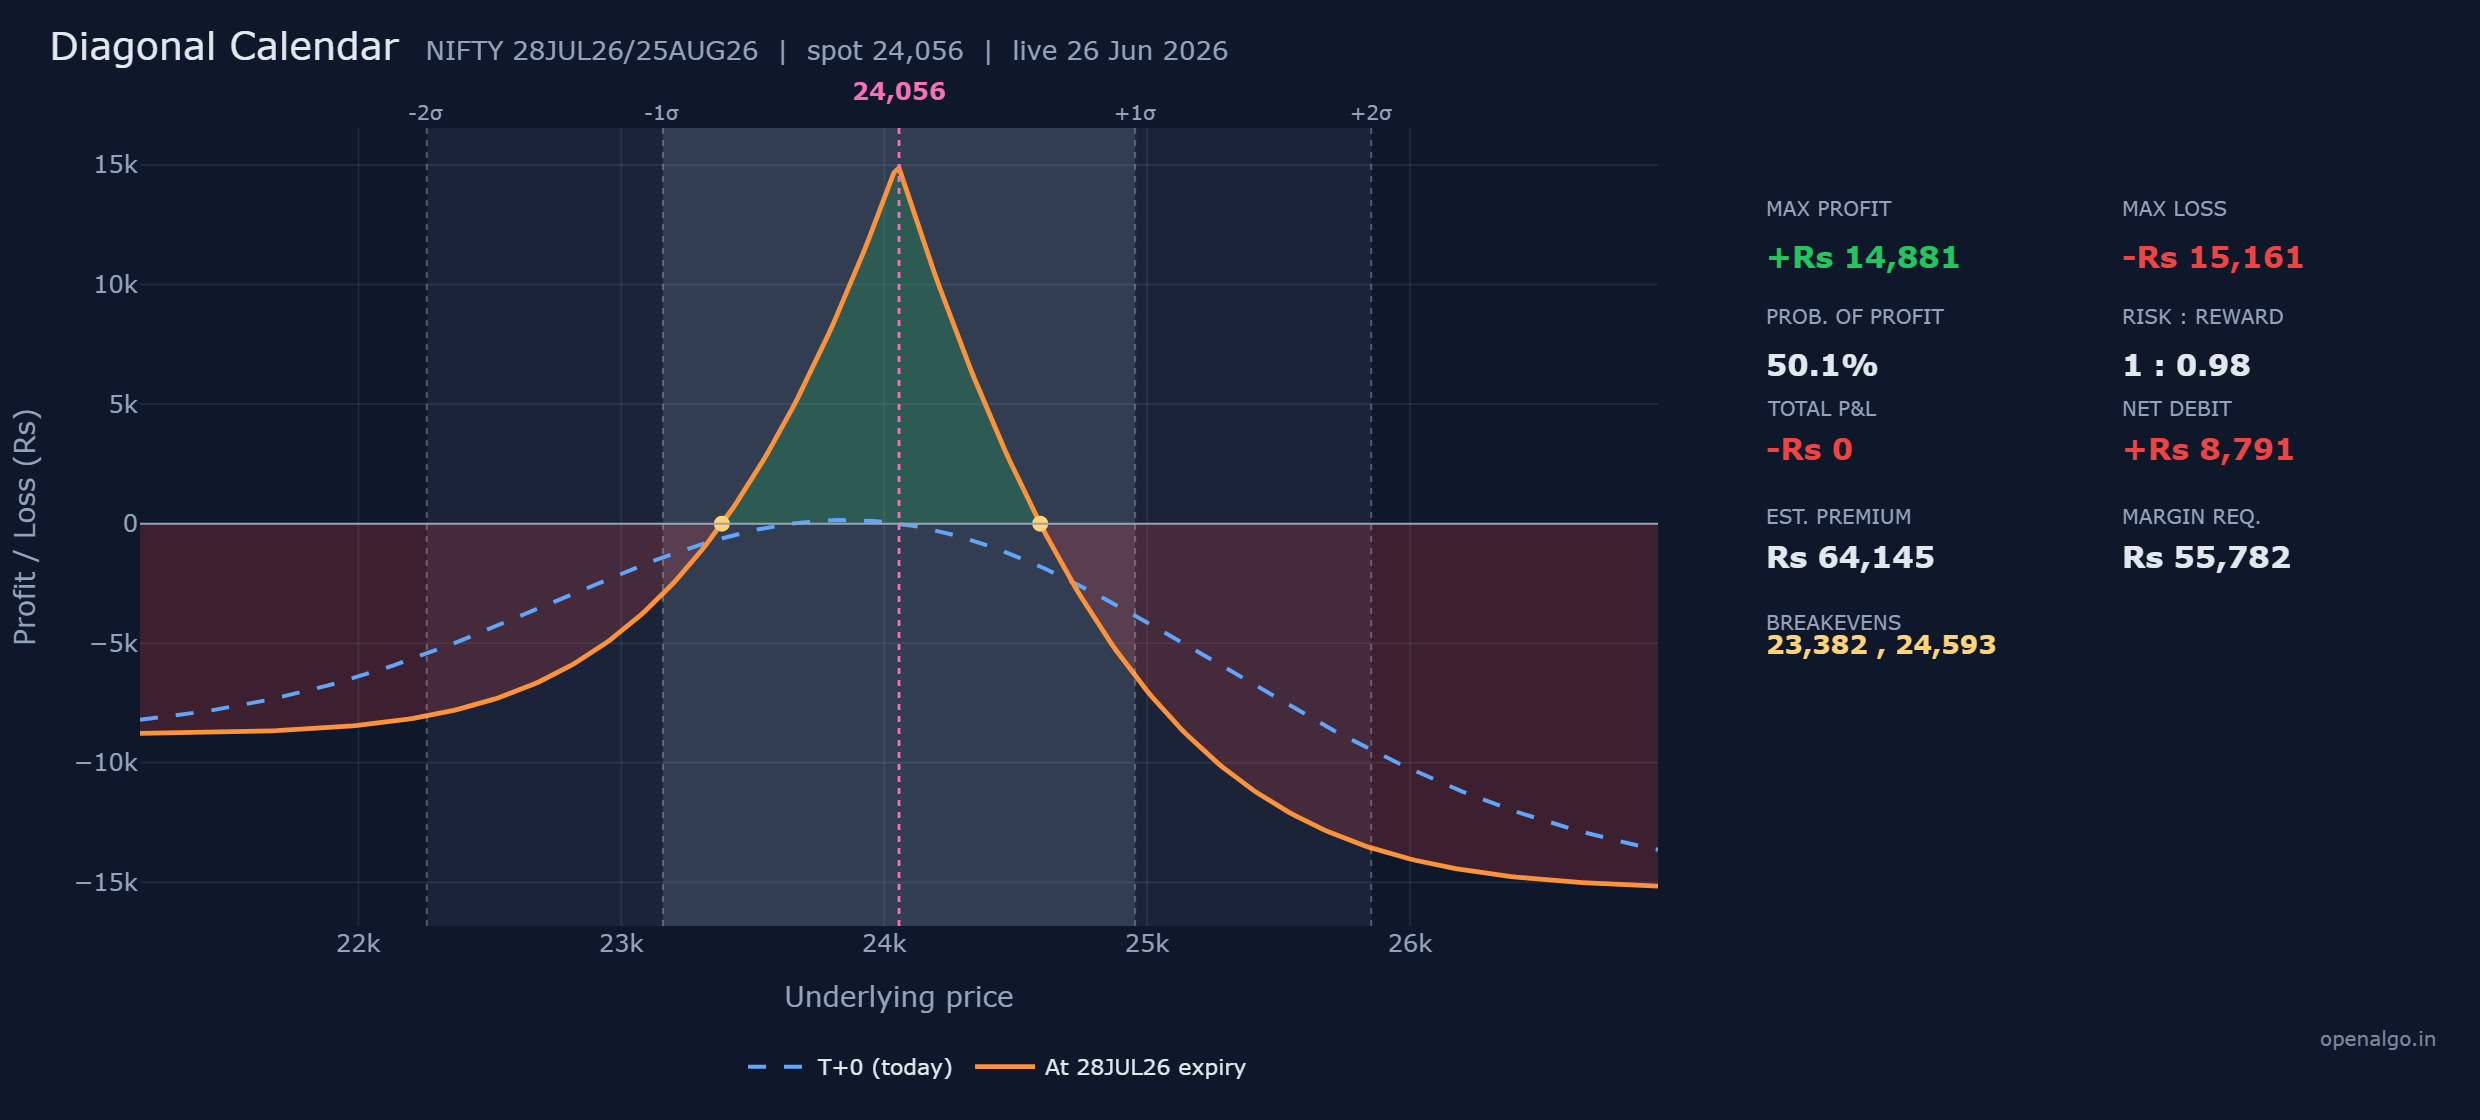
Because the far call sits one strike higher, the debit is smaller than a plain call calendar, about Rs 8,791, and the payoff is no longer balanced. Its breakevens, 23,382 and 24,593, sit wider apart, so it tolerates a larger move before it stops making money, which is why its probability of profit, about 50 percent, is the highest of the three. The price for that wider tent is a maximum loss of Rs 15,161, a touch more than the debit, because the strike gap means a sharp move can cost a little beyond what you paid. The maximum profit of Rs 14,881 still arrives when NIFTY drifts toward the back-month strike at the near expiry.
The diagonal is the calendar's more flexible cousin. By choosing how far apart the two strikes sit, you decide how wide the tent is and which way it leans, so you can express a mild directional view as well as a view on time. It is still defined-risk, but the strike gap makes its worst case slightly larger than the simple debit, unlike the plain calendars.
Choosing and managing a calendar
Put the three side by side and the trade-offs are clear.
| Strategy | Debit | Max profit | Max loss | Reward to risk | POP |
|---|---|---|---|---|---|
| Call calendar | Rs 13,130 | Rs 14,480 | Rs 13,090 | 1 : 1.11 | 47 percent |
| Put calendar | Rs 5,818 | Rs 11,236 | Rs 5,817 | 1 : 1.93 | 42 percent |
| Diagonal calendar | Rs 8,791 | Rs 14,881 | Rs 15,161 | 1 : 0.98 | 50 percent |
All three want the same thing, a calm NIFTY that lingers near the strike while the near-month leg decays away. They suit a market you expect to drift sideways for a few weeks, not one you expect to break out. Because the most you can lose is roughly the debit, they are a defined-risk way to sell time, with margins of about Rs 49,000 to Rs 58,000 rather than the lakhs a naked short would demand.
Unlike a short straddle or strangle, a calendar has no unlimited tail. You own the back-month leg, and that long option caps your loss at roughly the debit you paid. This makes calendars one of the few ways a beginner can sell time decay without open-ended risk. The cost of that safety is that you must also pay for the back-month option, so a calendar is a debit trade, not a credit one.
A calendar is defined-risk, but it carries a hidden sensitivity a beginner must respect: implied volatility. The back-month leg you own holds more volatility than the front leg you sold, so a sharp drop in implied volatility after you enter can shrink the tent and hand you a loss even if NIFTY behaves perfectly. The tent is real only near the strike, so a calendar placed just before a known event that could send NIFTY flying is a poor bet. Trade calendars in calm conditions, not into a scheduled shock.
Rehearse the shape in sandbox trading (analyzer mode in OpenAlgo) and watch the tent rise and fall as you nudge the strikes and expiries. With calendars you have learned to trade time as well as direction. Next we return to the straight line, the synthetic future.
Key takeaways
- A calendar spread sells the near-month option and buys the far-month one at the same strike, profiting from the faster decay of the front leg.
- The payoff is a tent peaking at the strike on the near expiry, where the dead front leg and the living back leg are furthest apart.
- The call calendar costs Rs 13,130, peaks at Rs 14,480, and breaks even at 23,495 and 24,634, a return on margin near 25 percent at the peak.
- The put calendar is the cheapest route to the same shape here, a Rs 5,818 debit for an Rs 11,236 peak and a 1 to 1.93 reward to risk; the diagonal widens and leans the tent for the highest 50 percent odds but a worst case of Rs 15,161.
- Calendars are defined-risk and the only structures here that time decay helps, but they are sensitive to a drop in implied volatility and want a calm, event-free month.