Earnings, Dividends & Events That Move Prices
Results season, dividends, guidance, management changes and shock events - the calendar of catalysts every investor learns to watch.
- ·The earnings calendar
- ·How results move prices
- ·Dividends & record dates
- ·Guidance & surprises
- ·Shock events
- ·Building a watch routine
A stock can drift quietly for weeks, barely moving - and then jump or crash 10% in a single morning. To a newcomer it looks random, even unfair. But almost always, there was a date behind that move, sitting on a calendar that anyone could have seen coming. Companies report their profits on schedule, pay dividends on schedule, and the country has its budget and election days marked years in advance.
The last chapter was about the slow weather of macro forces. This one is about the sharp, scheduled jolts - the catalysts. Learning the calendar of events that move prices is one of the most practical skills an investor can build, because it turns "why on earth did it just drop?" into "ah, results were due today." Let us walk through the big ones.
Results season: the market's quarterly report card
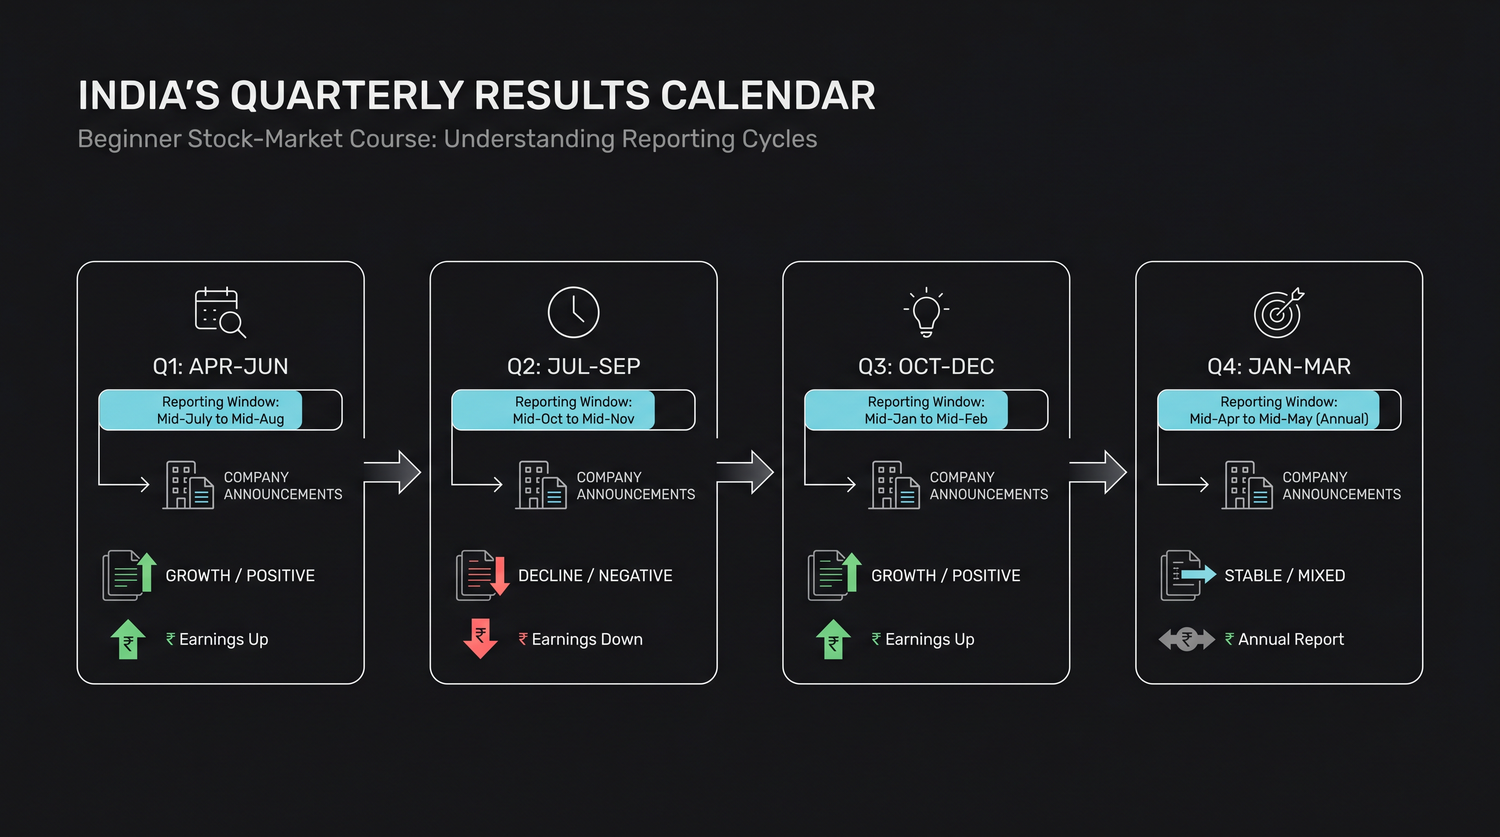
Every listed company in India must report its financial results four times a year, once per quarter:
- Q1 covers April to June, Q2 July to September, Q3 October to December, and Q4 January to March.
- Results are announced a few weeks after each quarter ends, so a flood of company announcements lands across roughly a six-week stretch. That stretch is called results season (or earnings season).
When the numbers come out, four things matter most:
- Revenue (the "top line") - total sales the company made.
- Net profit (the "bottom line") - what is left after all costs and taxes.
- Margins - profit as a percentage of revenue, which shows how efficiently the company turns sales into profit.
- Growth - compared to the same quarter last year (year-on-year, or YoY) and to the previous quarter (quarter-on-quarter, QoQ).
Why a stock can post record profit and still crash
Here is the part that surprises every beginner: the share price does not react to the raw number - it reacts to the number versus what the market already expected. Analysts and investors carry an expectation into results day (often called the "estimate" or "the street's number"). The stock has already been priced for that expectation.
- Beat expectations - profit comes in higher than hoped - and the stock often jumps.
- Miss expectations - lower than hoped - and it often falls.
- Meet expectations exactly, and the reaction is usually muted.
So a company can announce its highest-ever profit and still fall - because the market expected even more. The surprise, not the number, moves the price.
Share prices move on the surprise relative to expectations, not on the absolute result. "Good results" can sink a stock if the market hoped for great ones, and "weak results" can lift a stock if everyone feared worse.
This also explains an old market saying: "buy the rumour, sell the news." A stock often rises in the days before results as people position for good numbers. By the time the good news is actually announced, it is already baked into the price - so the stock can drift down even on a solid report, as early buyers take their profit.
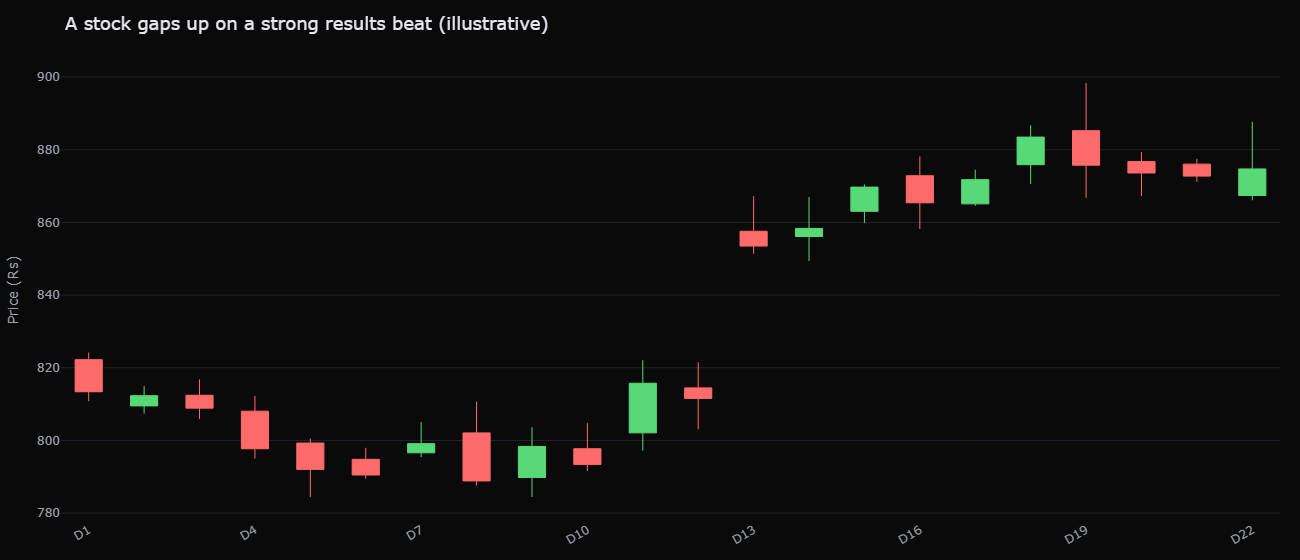
Picture it concretely. Suppose the market expects a company to grow its quarterly profit by 15%. If it reports 20%, the stock may gap up sharply - a happy surprise. If it reports only 12% - still real growth - the stock may fall, because it fell short of the bar. Same company, real growth either way, opposite reactions, all decided by expectations.
Dividends: getting paid to hold
A dividend is a cash payout a company shares with its shareholders out of its profits - say Rs 10 per share. Own 100 shares, and Rs 1,000 lands in your bank account. It is one of the two ways stocks reward you (the other being the price rising over time).
Three dates matter, and understanding them saves a lot of needless panic:
- Announcement date - the company's board declares the dividend and its amount.
- Ex-dividend date - the cut-off. Own the share before this date and you receive the dividend; buy it on or after this date and you miss this particular payout.
- Record date - the date the company checks its books to confirm who the eligible shareholders are.
Now the part that scares beginners. On the ex-dividend date, the stock price typically opens lower by roughly the dividend amount. If a Rs 500 stock is paying a Rs 10 dividend, it may open near Rs 490. New investors see red and assume something went wrong.
The ex-dividend drop is not a loss - it is simple arithmetic. The company has handed out cash, so the business is worth exactly that much less, and the share price adjusts down by about the dividend. You are not poorer: the value simply moved from "share price" into "cash in your account." Do not panic and do not sell over it.
A related number you will hear is dividend yield - the annual dividend divided by the share price, expressed as a percentage. A Rs 20 yearly dividend on a Rs 400 stock is a 5% yield. It tells you how much cash income the stock throws off relative to its price.
Some of India's steadiest blue-chip and public-sector companies have paid dividends without a break for decades. For long-term holders, those payouts - reinvested year after year - quietly compound into a meaningful slice of total returns, on top of any rise in the share price.
Guidance and management commentary
Often, what management says about the future moves the stock more than the results themselves - because markets are forward-looking. After releasing results, companies hold an earnings call (or "concall") where management discusses the quarter and answers analysts' questions. Two things to listen for:
- Guidance - the company's own forecast for future revenue, margins or growth. Raising guidance signals confidence and often lifts the stock; cutting it can sink the stock even on good current results.
- Tone - confident and expansive, or cautious and defensive. Seasoned investors read the mood as much as the numbers.
When you read a result, do not stop at the profit figure. Skim the management commentary and guidance too. A backward-looking number tells you where the company has been; guidance hints at where it is going - and the market pays for the future.
Other events that jolt a single stock
Beyond results, a handful of one-off events can move a specific stock fast:
- Mergers and acquisitions (M&A) - one company buying another. The company being acquired often jumps; the buyer can move either way.
- Regulatory news - a new rule, ban, approval, penalty or tax change affecting a company or sector.
- Management changes - a respected CEO leaving, or a strong new leader joining.
- Index inclusion or exclusion - when a stock is added to the Nifty 50 or Sensex, index funds are forced to buy it, creating demand; removal does the reverse.
- Big orders, court rulings, credit-rating changes - any news that changes the outlook for future profits.
Shock events: when the whole market lurches
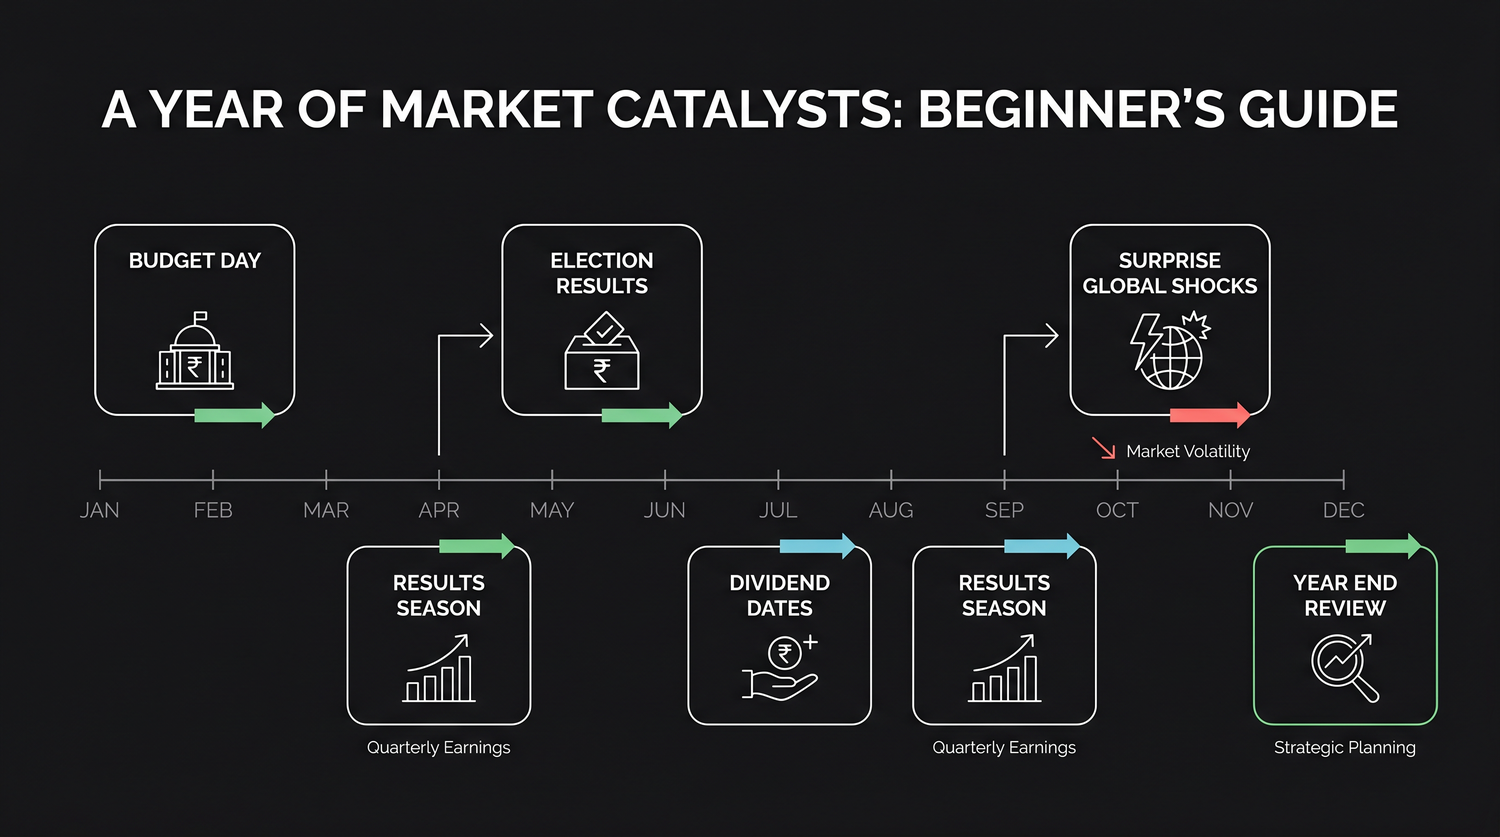
Some events move everything at once, not just one stock:
- Union Budget day (1 February) - changes to taxes, spending and sector policy can swing the market in minutes.
- Election results day - national and big state results can produce dramatic single-day moves as investors reprice the political outlook.
- Unscheduled global shocks - a pandemic, a war, a banking scare, a surprise central-bank move. These arrive without warning and can jolt the whole index.
You cannot diary the unscheduled ones, but knowing they exist keeps you calm when one hits.
Building a simple watch routine
You do not need a Bloomberg terminal. A beginner's routine can be light:
- Keep a small watchlist of the few stocks you own or follow closely.
- Note their results dates - companies announce them in advance, and exchanges publish the calendar.
- Before results, have a rough sense of what is expected; after results, check the simple question: did they beat or miss, and did guidance improve or worsen?
- Mark ex-dividend dates so the price drop never surprises you.
- Most importantly, do not trade the noise. A single quarter rarely changes a sound long-term view. Watch the calendar to learn how your companies behave, not to jump in and out.
Results days are among the most volatile and unpredictable sessions for a stock - prices can whip in both directions within minutes. For a beginner, that is the worst possible moment to trade on impulse. Let the dust settle, read the full picture, and judge the business over many quarters, not one.
Quick recap
- Listed companies report results four times a year; the six-week rush is results season, watched for revenue, profit, margins and growth.
- Prices react to the surprise versus expectations, not the raw number - which is why record profits can still sink a stock, and "buy the rumour, sell the news" plays out.
- A dividend is cash from profits; the stock drops by roughly the dividend on the ex-dividend date - normal arithmetic, not a loss.
- Guidance and management commentary about the future often move a stock more than the past quarter's numbers.
- M&A, regulation, management changes, index inclusion and shock events (Budget, elections, global crises) are other catalysts to know.
- Build a light watch routine around the results calendar - and resist trading the noise of a single volatile session.
You now understand what moves prices, from the slow macro weather to the sharp scheduled catalysts. In the next chapter we get practical: how an ordinary saver actually becomes an investor - opening an account, the two paths of direct stocks versus index-fund SIPs, and a sensible roadmap to start small and safe.