Anatomy of a Stock Quote
LTP, bid and ask, open-high-low-close, volume and the 5-level market-depth window - every number on a quote screen, explained on real, current market data.
- ·LTP & last traded quantity
- ·Bid, ask & the spread
- ·Open, high, low, close
- ·Volume
- ·Market depth (the order book)
- ·Circuit limits
The first time you tap on a stock and the quote screen opens, it can feel like staring into an airline cockpit - a wall of numbers, arrows and tiny tables, all changing at once. Yet every single figure there is telling you something simple and useful about one question: at what price are people buying and selling this share right now, and how badly do they want to?
Once you can read a quote, the market stops being noise and starts being a conversation. In this chapter we will decode every number on a typical screen using one running example - Reliance Industries on the NSE. The figures below are an illustrative snapshot for teaching, not a real-time price, but they are arranged exactly as a real quote would be.
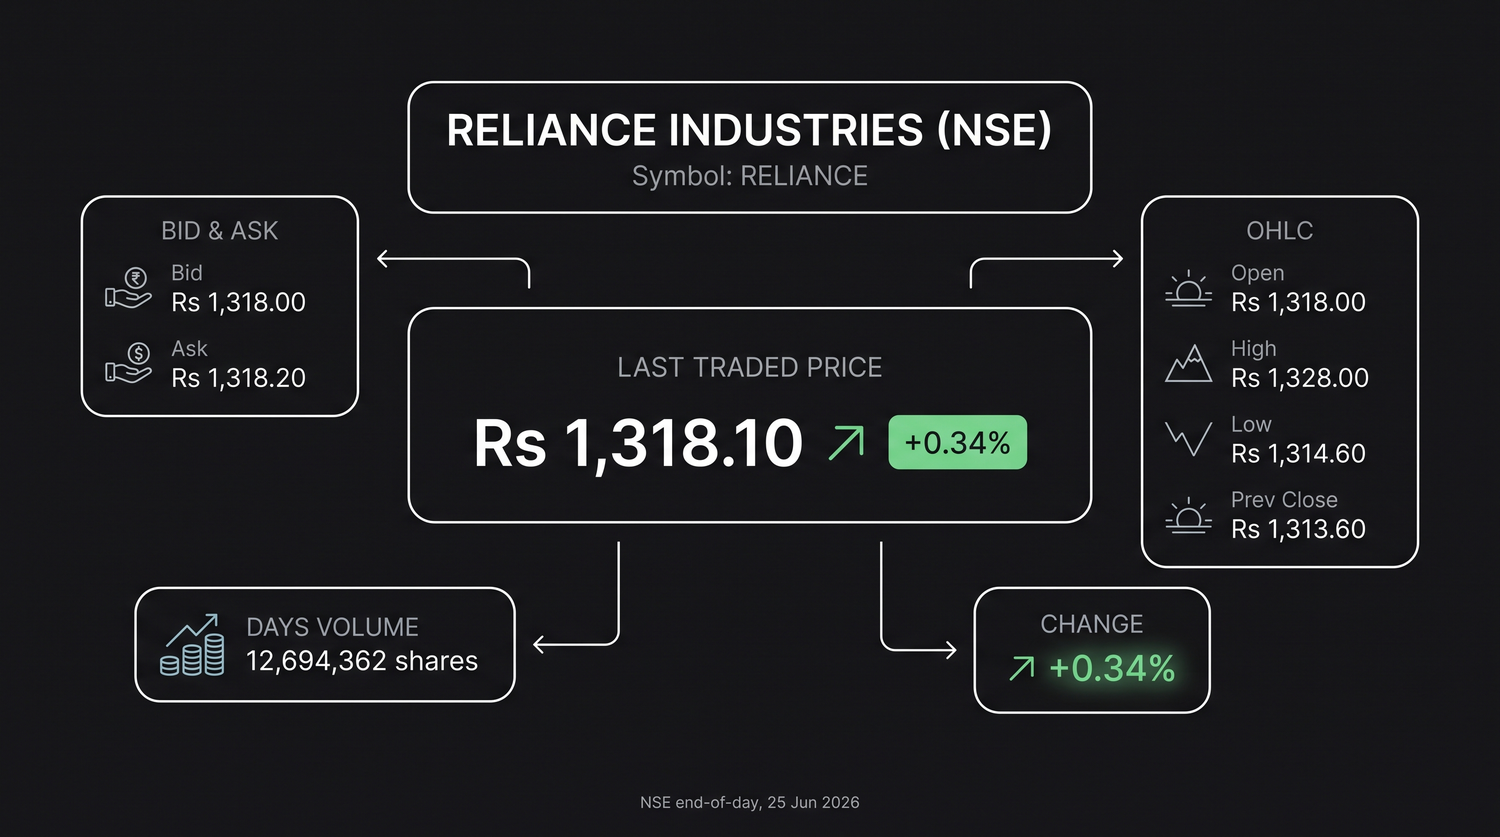
The headline: LTP and last traded quantity
The biggest number on the screen is the LTP - the Last Traded Price. It is simply the price at which the most recent trade in this stock actually happened. Not an average, not an estimate - the last real handshake between a buyer and a seller.
| Field | Value (snapshot) |
|---|---|
| LTP | Rs 1,476.30 |
| Last traded quantity | 45 shares |
| Previous close | Rs 1,468.50 |
| Change | +Rs 7.80 (+0.53%) |
Right beside it sits the last traded quantity - how many shares changed hands in that final trade (here, 45). The change compares the LTP with yesterday's previous close, and is shown in rupees and as a percentage. Green means the stock is above yesterday's close, red means below. That percentage - not the rupee figure - is what people mean when they say a stock is "up half a percent."
The LTP is history, not a promise. It tells you where the last trade did happen, not where the next one will. The very next trade can occur at a different price - which is exactly what the bid and ask, coming up next, help you anticipate.
Bid, ask and the spread
A stock does not have one single price; it has two prices at every instant:
- The bid is the highest price a buyer is currently willing to pay.
- The ask (or offer) is the lowest price a seller is currently willing to accept.
In our snapshot the best bid is Rs 1,476.20 and the best ask is Rs 1,476.30. A trade only happens when a buyer agrees to pay the ask, or a seller agrees to take the bid - the moment they meet, a new LTP is born.
The gap between them - here just Rs 0.10 - is the spread. It is a quiet but powerful quality signal:
- A narrow spread (a few paise, like Reliance) means the stock is liquid - lots of buyers and sellers, easy to trade near a fair price.
- A wide spread (rupees apart) means the stock is illiquid - thin interest, and you may pay up or sell down just to get a trade done.
Before buying any small or unfamiliar stock, glance at the spread. A wide spread is a warning that getting out later could cost you more than you expect - the price has to move in your favour just to cover the gap you crossed on the way in.
Open, high, low, close: the day's story in four numbers
Four numbers - together called OHLC - summarise the whole trading day:
| Value (snapshot) | |
|---|---|
| Open | Rs 1,470.00 |
| High | Rs 1,482.70 |
| Low | Rs 1,466.20 |
| Previous Close | Rs 1,468.50 |
- Open - the price of the first trade when the market opened at 9:15 am.
- High - the highest price touched so far today.
- Low - the lowest price touched so far today.
- Close - the final price of the day (until the market closes, the previous close stands in as the reference).
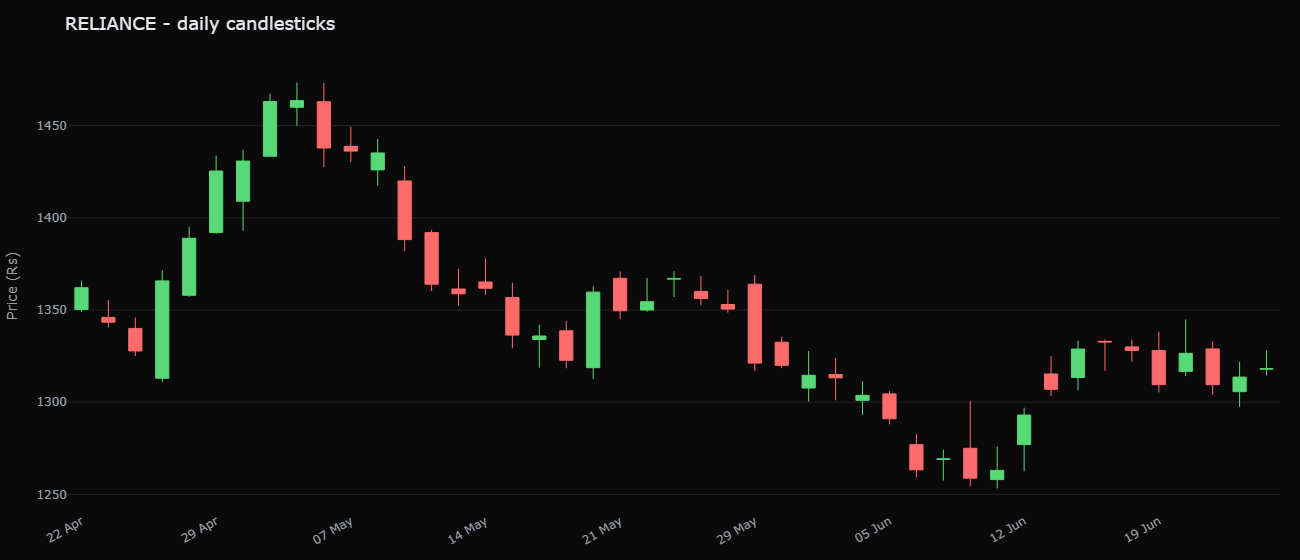
These four are the raw material of every candlestick on a price chart: each candle packs one period's open, high, low and close into a single shape. Learn to read OHLC and you are already reading candles.
Volume: how much conviction is behind the move
Volume is the total number of shares traded over the day - in our snapshot, about 85 lakh shares so far. Volume is the market's intensity dial. A price move on heavy volume means many participants agree and are acting on it; the same move on thin volume is a handful of trades that may not stick.
- Price up + high volume = a move with real conviction behind it.
- Price up + low volume = a tentative drift that can easily reverse.
On the NSE, an active large-cap like Reliance can trade well over a crore shares in a single day - that is shares worth thousands of crores of rupees changing hands between 9:15 am and 3:30 pm. Each one of those trades updated the LTP you see. The quote screen is the surface of an ocean of orders moving underneath.
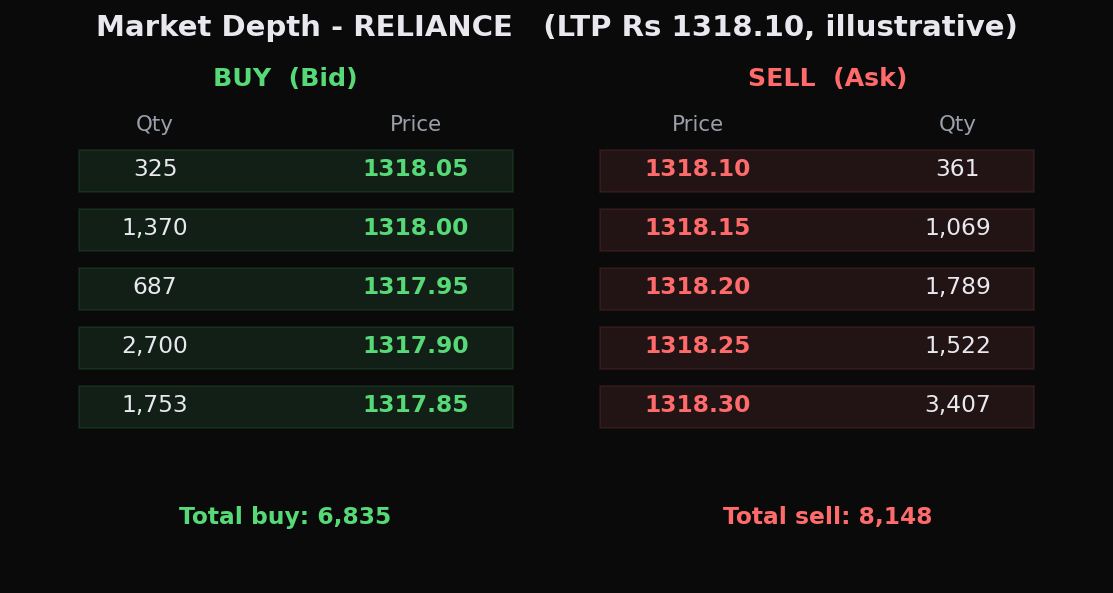
Market depth: the five-level order book
Here is the part that separates a casual viewer from someone who truly reads a quote - the market depth, also called the order book. It shows the five best buy orders and five best sell orders waiting in the queue, with their prices and quantities. (Standard retail screens show five levels each side; that is all we need.)
| Bid qty | Bid price | Ask price | Ask qty |
|---|---|---|---|
| 320 | 1,476.20 | 1,476.30 | 280 |
| 540 | 1,476.10 | 1,476.40 | 610 |
| 1,250 | 1,476.00 | 1,476.50 | 900 |
| 410 | 1,475.90 | 1,476.60 | 350 |
| 760 | 1,475.80 | 1,476.70 | 1,100 |
Read it like two staircases meeting in the middle. The left side is demand - buyers stacked just below the current price. The right side is supply - sellers stacked just above. The top row holds the best bid and best ask we already met; each row below is a slightly worse price waiting its turn.
The depth window reveals where the pressure is. If the buy quantities dwarf the sell quantities, there is more demand than supply pressing up against the price - and vice versa. Many screens also total it up as total buy quantity and total sell quantity across all pending orders, a quick read of the overall tug-of-war.
Market depth is supply and demand made visible. A large order sitting on the bid can act like a temporary floor; a wall of sell orders just above can act like a ceiling. It is not a crystal ball - those orders can be cancelled in an instant - but it shows you the immediate balance of buyers and sellers around the current price.
Circuit limits: the market's safety valve
To stop a stock from rising or crashing uncontrollably in a single session, the exchange sets a price band - and the edges of that band are the circuit limits:
- The upper circuit is the maximum the price may rise today.
- The lower circuit is the maximum it may fall today.
Bands are commonly 2%, 5%, 10% or 20%, depending on the stock. When a stock hits its upper circuit, there are only buyers and no sellers, so trading effectively freezes at that price; at the lower circuit, the reverse. Thinly traded small-caps slam into their circuits regularly, which is one more reason they are risky. Large, liquid stocks in the derivatives segment have wider, flexible bands and rarely lock - but the safety valve is always there.
A stock "locked in the upper circuit" can look thrilling, but it is a trap for the impatient: if you bought one frozen there, you cannot sell until buyers appear - and when a hyped small-cap finally turns, it can hit lower circuits day after day with no buyer in sight, leaving you unable to exit. Circuits cut both ways.
Quick recap
- The LTP is the price of the last actual trade, with the change measured against yesterday's previous close - usually read as a percentage.
- The bid (best buyer) and ask (best seller) bracket the price; the spread between them signals how liquid the stock is.
- OHLC - open, high, low, close - tells the day's story in four numbers and forms every candlestick on a chart.
- Volume measures conviction: a move on heavy volume means business; on thin volume, treat it with caution.
- The five-level market depth shows the five best buy and sell orders waiting - supply and demand made visible around the current price.
- Circuit limits cap how far a stock can move in a day, freezing runaway rises and crashes - and trapping the impatient.
You can now read a single stock's quote with confidence. Next we zoom out to the numbers everyone quotes on the news - the Nifty and the Sensex - and see exactly how an index is built from dozens of these individual stocks, and why it rises and falls.