Historical vs Implied Volatility, and the Expected Move
Implied volatility only means something next to history. Learn how historical volatility compares to IV, the idea of IV rank, and how the market prices an expected range, with the at-the-money straddle as a quick expected-move gauge.
- ·Historical vs implied volatility
- ·The idea of IV rank or percentile
- ·Why expensive does not mean bad
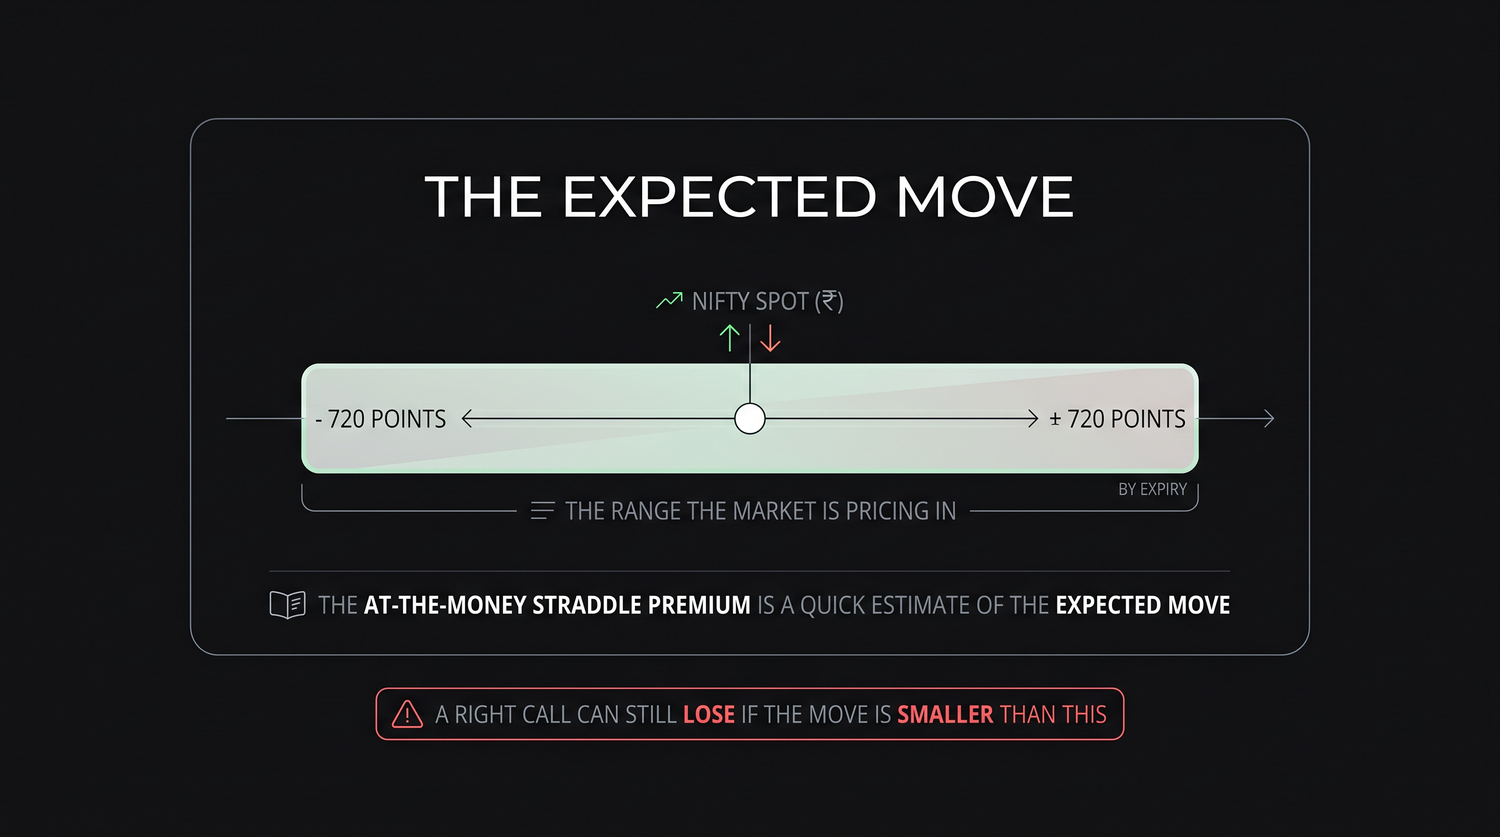
- ·The expected move explained
- ·The ATM straddle as a gauge
- ·Why a right call can still lose
A single number sits next to almost every option you look at, usually quoted as a percentage. It is implied volatility, often shortened to IV, and beginners tend to glance at it, decide that a bigger number means a better chance of a big move, and move on. That instinct is wrong, and it costs people money. On its own, an IV number tells you almost nothing. It only becomes useful when you compare it to two things: what the stock has actually been doing, and what this same option usually costs. This chapter teaches you to make both comparisons, and then turns IV into something genuinely practical, the expected move, which is the market's own guess at how far price will travel before expiry.
Two kinds of volatility
There are two volatility numbers worth knowing, and they answer two different questions.
- Historical volatility, sometimes called realised volatility, measures how much the underlying actually moved over some past window, say the last twenty or thirty trading days. It is a fact about the past. It looks backward and says, this is how jumpy the stock has really been.
- Implied volatility is baked into the option premium right now. It is the market's expectation of how much the underlying will move between today and expiry. It looks forward. When option buyers are nervous and bid premiums up, IV rises. When the market is calm and premiums are cheap, IV falls.
The two are related but they are not the same, and the gap between them is where a lot of the story lives. If RELIANCE has been quietly drifting and its historical volatility is low, but its implied volatility is high, the market is paying up for a move it expects but has not yet seen. Maybe results are due. If implied volatility is sitting below what the stock has actually been delivering, options look cheap relative to recent reality.
Historical volatility is what the stock did. Implied volatility is what the market expects it to do, priced into the premium today. One looks back, one looks forward, and the difference between them is information.
RELIANCE in our running example carries an IV of about 20 percent. That number alone means nothing until you ask two questions. Is 20 percent high or low for RELIANCE specifically? And how does it compare to how much RELIANCE has actually been moving lately? A 20 percent IV is calm for one stock and stormy for another. Volatility is always relative to the underlying it belongs to.
Is today's IV high or low? IV rank and IV percentile
Because a raw IV number is meaningless without context, traders rank it against its own past. Two simple measures do this.
- IV rank asks where today's IV sits between its lowest and highest readings over the past year. If RELIANCE IV ranged from a low of 14 percent to a high of 34 percent over the last twelve months, and today it is 20 percent, then today sits 6 points above the low out of a 20 point range, which is an IV rank of about 30 percent. Today's IV is on the lower half of its yearly range.
- IV percentile asks, on how many days in the past year was IV lower than it is today? If IV has been below today's level on 40 percent of days, the IV percentile is 40. It is a slightly more honest measure because it accounts for how IV was distributed, not just the extremes.
You do not need to compute these by hand. The point is the habit. Before you decide an option is expensive or cheap, you check whether its current IV is high or low for that specific underlying. A 20 percent IV that is near the top of RELIANCE's own range is a very different setup from a 20 percent IV near the bottom, even though the number on the screen is identical.
Never judge an option's IV in isolation. Ask where it sits in its own yearly range. A high IV rank means premiums are richer than usual for this underlying; a low IV rank means they are cheaper than usual. The same percentage can be expensive on one stock and cheap on another.
Expensive does not mean bad, cheap does not mean good
Here is the trap. Beginners learn that high IV makes options expensive, and they conclude that they should never buy a high-IV option and should always prefer a cheap one. Both halves of that are wrong.
A high-IV option is expensive because the market expects a big move. If the move turns out to be even bigger than priced, the expensive option pays off handsomely. You were charged a lot, and you got a lot. Buying high IV is not automatically a mistake. It is only a mistake if the move disappoints relative to what you paid for.
A low-IV option is cheap because the market expects calm. But cheap is not the same as likely to win. If the stock keeps sitting still, that cheap option still bleeds its time-value to zero and expires worthless. You paid little, and you got nothing. Cheap options lose money every day too.
The right question is never simply, is this expensive or cheap? It is, will the actual move be bigger or smaller than the move already priced into this premium? That comparison is what separates a good entry from a bad one, and it leads directly to the single most useful idea in this chapter.
Cheap options are not safer and expensive options are not worse. A cheap option that does not move is a total loss; an expensive option that moves more than priced is a winner. Price tells you what the market expects, not what will happen.
The expected move: the range the market is pricing
Every option premium contains a hidden forecast. Add up what the market charges for an at-the-money call and an at-the-money put on the same strike and expiry, and you get a quick, surprisingly good estimate of how far the market thinks the underlying will travel by that expiry. That combined premium is the at-the-money straddle, and it is the simplest read of the expected move.
Let us use the real NIFTY numbers. NIFTY spot is about 24,056, and the nearest strike is 24,050 for the 28 July monthly expiry. The at-the-money call trades around Rs 426 per share and the at-the-money put around Rs 295 per share. Add them together, Rs 426 plus Rs 295, and you get about Rs 720. That Rs 720 is the at-the-money straddle premium, and it is the market's own estimate of the expected move. In plain words, the market is pricing NIFTY to travel roughly 720 points in either direction by 28 July. The expected range is about 24,056 plus or minus 720, which runs from roughly 23,336 on the downside to roughly 24,776 on the upside.
The NIFTY at-the-money straddle for 28 July is about Rs 720, the call near Rs 426 plus the put near Rs 295. That Rs 720 is the market's expected move: roughly plus or minus 720 points by expiry, a range from about 23,336 to about 24,776.
This is not a guarantee and it is not a prediction of direction. It is a one-standard-deviation style estimate, meaning the market roughly expects the close to land inside that band about two times out of three, and outside it the other third of the time. The expected move can be wrong in both directions: the actual move can be far larger or far smaller. But it gives you a fair, market-implied yardstick to measure your own trade against, and it costs you nothing to read it straight off the straddle.
The table below makes the relationship concrete.
| Reading | NIFTY example (28 July) |
|---|---|
| Spot | about 24,056 |
| At-the-money strike | 24,050 |
| At-the-money call premium | about Rs 426 per share |
| At-the-money put premium | about Rs 295 per share |
| At-the-money straddle (expected move) | about Rs 720 per share |
| Expected range by expiry | about 23,336 to 24,776 |
Why a correct call can still lose
Now the expected move pays off as a lesson. Suppose you are convinced NIFTY will rise, so you buy a call. NIFTY does rise, by 300 points, by expiry. You were right on direction. Yet you can still lose money, and the expected move explains exactly why.
The market had already priced in a move of about 720 points. The premium you paid assumed roughly that much travel. A 300 point rise is real, but it is less than half of what was already baked into your premium. The time-value you paid for the larger expected move melts away, and the modest actual move does not earn it back. You were right, and you still lost, because the move was smaller than the move you paid for.
This is the deeper meaning of the warning that runs through this whole course: being right on direction is not enough. You have to be right relative to what is already priced in. The expected move is the bar. If you buy premium, the underlying has to clear that bar, not merely move in your favour. If you sell premium, you are betting the underlying stays inside the expected move, and the same Rs 720 becomes the cushion you are trying to keep.
You buy a NIFTY call expecting a rally. NIFTY climbs 300 points by 28 July. You were right on direction, but the market had priced a roughly 720 point move into your premium. The actual 300 point move falls short of what you paid for, so the option can still finish as a loss. Right direction, wrong size, money gone.
So volatility is not a single number to glance at. It is a comparison. Hold implied volatility up against historical volatility to see whether the market is paying for more or less than the stock has been delivering. Hold today's IV against its own yearly range, through IV rank or percentile, to see whether premiums are rich or cheap for this specific underlying. And turn the at-the-money straddle into an expected move so you have a concrete yardstick. Once you measure your trade against the move that is already priced in, the puzzle of being right on direction and still losing money finally makes sense.