Open Interest, Volume and PCR
Open interest is the most quoted and most misread number in options. Learn what OI actually means, how to read a build-up versus an unwinding or short covering, the put-call ratio, and why none of it is a crystal ball.
- ·What open interest means
- ·OI build-up vs unwinding
- ·Short covering explained
- ·Volume vs open interest again
- ·The put-call ratio (PCR)
- ·Why OI is not a prediction machine
Open the option chain on any active underlying and you will see two columns of numbers that beginners constantly confuse: volume and open interest. People treat them as the same thing, or worse, they read a big open interest figure as a crowd telling them where price is headed. Neither habit is right. Open interest and the put-call ratio are among the most over-read numbers in all of options trading. They are genuinely useful, but only if you understand exactly what they measure, which is positioning, not prophecy. This chapter explains what open interest really is, how to read its changes honestly, what the put-call ratio can and cannot tell you, and why a beginner who leans on these numbers as a prediction machine is going to get hurt.
Open interest is not volume
Start with the difference that trips everyone up.
- Volume is the number of contracts traded during the session so far. It resets to zero every morning. A volume of 50,000 on a strike means 50,000 contracts changed hands today. Volume measures activity, the churn of the day.
- Open interest, often shortened to OI, is the number of contracts still open, meaning positions that have been opened and not yet closed. It does not reset daily. It carries over from session to session. Open interest measures how many open bets are sitting on that strike right now.
The simplest way to feel the difference: if you and another trader open a brand new contract between you, open interest rises by one. If two existing holders trade with each other and one is closing while the other opens, open interest does not change, even though volume ticked up. If both sides are closing out, open interest falls by one while volume still records the trade. Volume counts trades. Open interest counts open positions.
Volume is how many contracts traded today and resets each morning. Open interest is how many contracts are still open and carries over day to day. A strike can have huge volume yet flat open interest if traders are mostly passing existing positions around rather than creating new ones.
That distinction matters because a rising open interest tells you fresh money is committing to that strike, while flat or falling open interest tells you positions are being closed. Volume alone cannot tell you whether the day's activity built new exposure or unwound old exposure. Open interest can.
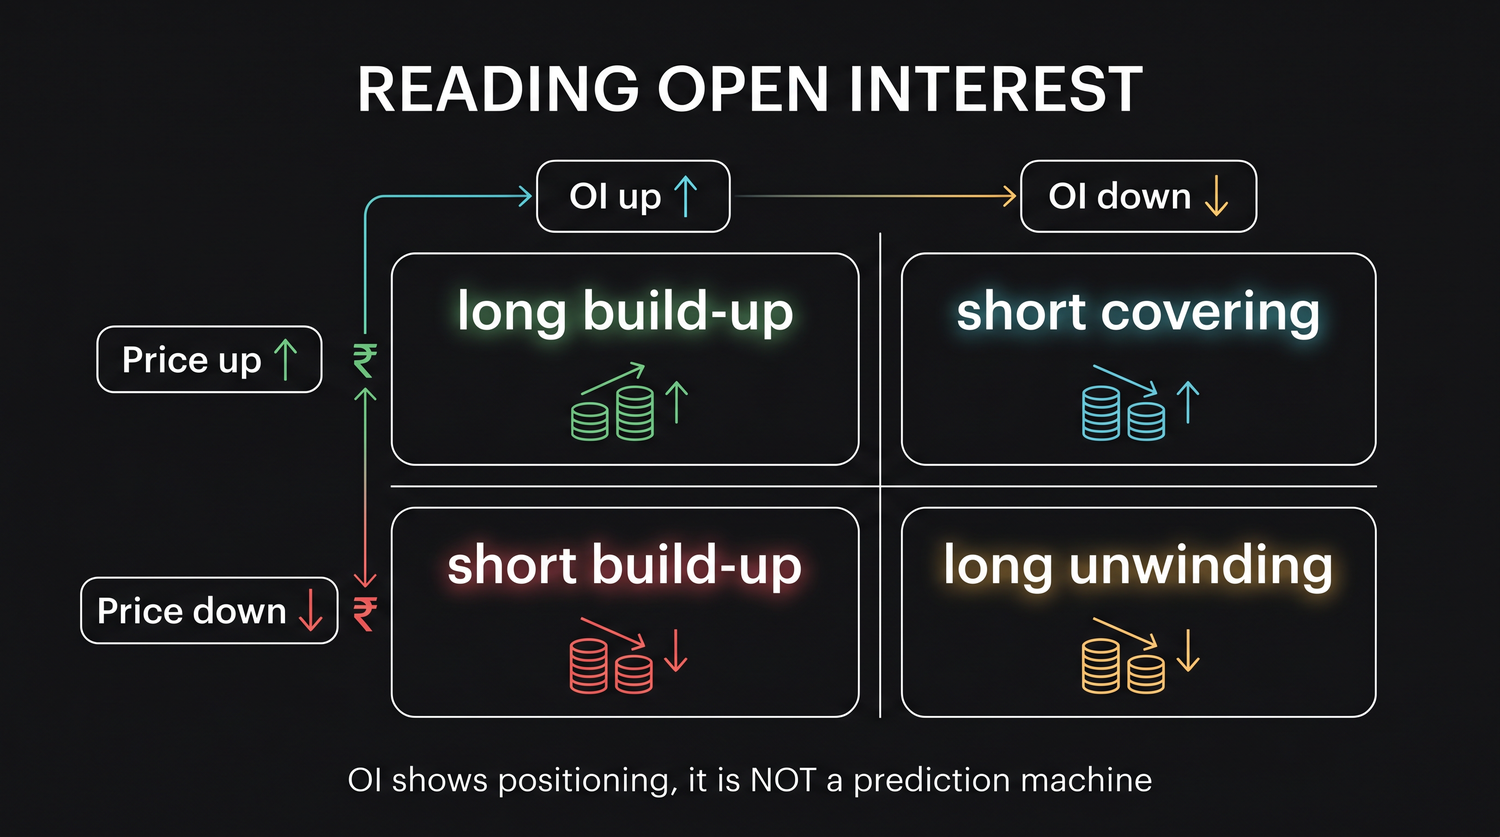
Reading OI changes honestly: the 2x2 matrix
Open interest becomes informative when you pair its change with the change in price. There are four combinations, and they form a small grid that is worth memorising. The logic is always the same: rising open interest means new positions are being created, and the direction of price tells you which side is doing the creating.
| Open interest rising | Open interest falling | |
|---|---|---|
| Price rising | Long build-up (fresh buyers adding) | Short covering (sellers buying back) |
| Price falling | Short build-up (fresh sellers adding) | Long unwinding (buyers closing out) |
Read each cell in plain words.
- Price rising with open interest rising is a long build-up. New buyers are stepping in and price is moving up with them. Fresh bullish money is committing. This is often read as the up-move having real participation behind it.
- Price falling with open interest rising is a short build-up. New sellers are stepping in and price is sliding with them. Fresh bearish money is committing. The down-move has real selling behind it.
- Price rising with open interest falling is short covering. Price is going up not because of new buyers but because existing sellers are buying back to close their losing shorts. The move can be sharp but it is driven by exits, and it can fade once the covering is done.
- Price falling with open interest falling is long unwinding. Price is going down because existing buyers are selling to close, not because of aggressive new shorts. Old longs are giving up.
The honest nuance: the first two, the build-ups, describe new conviction entering the market. The second two, covering and unwinding, describe old positions leaving. A move powered by fresh build-up is generally considered to have more behind it than a move powered purely by people closing out. But generally considered is doing a lot of work in that sentence, and we will come back to how shaky it can be.
Always read open interest together with price, never alone. A big open interest number sitting still tells you little. It is the change in open interest, paired with the direction of price, that hints at whether new money is building a position or old money is leaving.
Suppose NIFTY rises from around 24,056 while open interest on a nearby call strike climbs through the session. That pairing, price up and open interest up, reads as a long build-up: fresh buyers are committing to that strike. If instead NIFTY had risen while open interest on heavy short positions fell, the same up-move would read as short covering, sellers buying back rather than new bulls arriving. Same price move, very different story underneath.
Support, resistance and the OI walls
One common use of open interest deserves a careful, honest mention. Traders watch the strikes where put open interest and call open interest pile up. A strike with very large put open interest below the current price is sometimes treated as a support level, on the reasoning that the sellers of those puts have an interest in price staying above that strike. A strike with very large call open interest above the current price is sometimes treated as resistance, by the mirror logic. People call these the OI walls.
There is something to this, because large concentrations of open positions do attract hedging activity that can cluster price. But it is a soft tendency, not a rule. Open interest walls are not real walls. Those levels shift through the day as positions are added and removed, they break regularly, and on a trending day or around an event price slices straight through them. Treat them as one rough input among many, never as a fence price cannot cross, and never size a trade on the belief that an open interest level will hold.
The put-call ratio as a rough mood gauge
The put-call ratio, or PCR, takes all that open interest and squeezes it into one number. In its common form it is the total put open interest divided by the total call open interest across the chain. If puts and calls carry equal open interest, the PCR is 1.0. More puts open than calls pushes it above 1.0; more calls than puts pulls it below.
The textbook reading goes like this. A high PCR, well above 1, means a lot of puts are open, which is taken as bearish positioning, the crowd hedging or betting on a fall. A low PCR, well below 1, means calls dominate, taken as bullish positioning. So far this is just describing what is on the book.
Then comes the twist that confuses beginners: many traders read PCR as a contrarian signal. The reasoning is that when almost everyone has already bought puts and the PCR is very high, the bearish bet is crowded and most of the selling may already be done, so the next move could be up. When the PCR is very low and everyone is long calls, the bullish side is crowded and a pullback may be near. So the same number gets read two opposite ways depending on whether you treat it as momentum or as a crowded-trade warning. That alone should tell you how loose a tool it is.
| PCR reading | Literal positioning | How it is often read |
|---|---|---|
| Well above 1 | More puts open than calls | Bearish positioning, or contrarian bullish if crowded |
| Around 1 | Puts and calls roughly balanced | No strong tilt |
| Well below 1 | More calls open than puts | Bullish positioning, or contrarian bearish if crowded |
The put-call ratio compresses the whole chain into one number: total put open interest divided by total call open interest. Above 1 means more puts are open, below 1 means more calls. But the same reading is argued both as momentum and as a contrarian signal, which is your first clue that it is a mood gauge, not a forecast.
The honest limits: positioning is not prediction
Here is the part the beginner needs most, because it is the part the loud voices online skip. Open interest and the put-call ratio describe positioning. They tell you, with reasonable accuracy, what bets are currently on the book. They do not tell you what price will do next. Positioning is a photograph of the present, not a forecast of the future.
Three honest cautions. First, open interest does not reveal intent. A large block of open puts might be an outright bearish bet, or it might be a hedge protecting a big stock holding, or it might be one leg of a spread whose other leg you cannot see. The same number means very different things depending on why the position exists, and the chain never tells you why. Second, these numbers lag and shift. By the time a build-up is obvious, the move that built it may be largely done, and the positions can unwind as fast as they appeared. Third, PCR has no fixed threshold that works. The level that counted as extreme last year may be ordinary this year, because the normal range drifts with the market.
Beginners over-read all of this. They see a high PCR and feel certain of a bounce, or a fat call open interest and feel certain of a ceiling, and they bet real money on a single number as though it were a signal. It is not. At best, open interest and PCR are context, one more input that, combined with price action and your own plan, can colour a view. At worst, treated as a prediction machine, they are a fast way to feel confident and be wrong.
Open interest and the put-call ratio describe positioning, not the future. They are context, not a signal. Anyone who tells you a single open interest level or PCR reading reliably predicts the next move is selling certainty that the numbers cannot deliver. Use them to understand who is positioned where, never as a reason on their own to enter a trade.
So keep the two ideas separate in your head. Volume is today's churn; open interest is the stack of bets still open. Pair the change in open interest with the change in price and you can read whether a move is fresh build-up or old positions leaving. Squeeze the chain into a put-call ratio and you get a rough sense of crowd mood. All of that is genuinely useful as background. None of it is a crystal ball. The trader who respects that line uses these numbers well, and the one who forgets it hands them far more authority than they have ever earned.