Arrays vs Loops: the for-loop
Most AFL needs no loops - but some logic (like a trailing stop) does. Learn when and how to write a clean for-loop.
- ·When arrays are not enough
- ·for( i = 0; i < BarCount; i++ )
- ·Indexing an array with [i]
- ·Carrying state across bars
- ·A simple trailing-stop loop
- ·Loop performance & pitfalls
For nine chapters we have leaned on one beautiful idea: AFL works on whole arrays at once, so a single line like EMA(Close, 50) quietly does the work of a loop over thousands of bars. Ninety-five percent of everything you will ever write fits that mould, and you should reach for arrays first, always. But there is a small, important corner of trading logic that arrays genuinely cannot express - and this chapter is about recognising it and handling it cleanly.
AmiBroker only gained C-style for and while loops in version 4.70, back in 2004. Before that everything was done with arrays - which is still the faster route whenever a problem allows it.
That corner has a precise signature. It is any rule where a bar's value depends on the value the formula already computed on the previous bar - not the previous price, but the previous result. A trailing stop is the textbook case: today's stop is "yesterday's stop, but ratcheted up if price allowed." Supertrend, parabolic SAR, and most custom trailing exits share this shape. When you meet it, you need a loop.
Why arrays hit a wall
Array functions read inputs and produce outputs, but they cannot feed their own output from one bar back in as an input to the next bar. Consider a stop that may only ever rise, never fall, in an uptrend:
Today's stop = the larger of (a candidate stop just below today's price) and (yesterday's stop).
The phrase "yesterday's stop" is the problem. The stop array does not exist yet while it is being built - you are asking for a value you have not finished calculating. Ref(stop, -1) cannot help, because stop is still empty. This circular, step-by-step dependency is exactly what a loop is for: it walks the bars in order, and by the time it reaches bar i, bar i-1 is already finished and available.
Use a loop only when a bar's result depends on the previously computed result (trailing stops, Supertrend, state machines). For everything else - moving averages, conditions, crossovers, sums - arrays are faster, shorter and clearer. Loops are the exception, not the default.
The shape of a for-loop
AFL's loop is the familiar three-part for from most programming languages:
for( i = 0; i < BarCount; i++ )
{
    // ... do something at bar i ...
}
Read it as three clauses separated by semicolons: start at i = 0; keep going while i < BarCount; and after each pass do i++ (add one to i). BarCount is the total number of bars on the chart, so this visits every bar from the first to the last, in order.
Inside the loop, i is the bar we are standing on. We reach a single bar's value of an array with square brackets - Close[i] is the close at bar i, Close[i-1] is the close at the bar before it:
for( i = 1; i < BarCount; i++ )   // start at 1 so i-1 is always valid
{
    change = Close[i] - Close[i-1];   // this bar's close minus the previous
}
Indexing off the ends of an array is a classic bug. Close[i-1] on the very first bar (i = 0) would ask for bar -1, which does not exist. The fix is simple: when your loop looks one bar back, start at i = 1, as above. Likewise never read Close[i+1] in a signal - that is look-ahead bias wearing a loop costume.
Watch a loop fill the array
Before the trailing stop, here is the gentlest possible loop: a running maximum - the highest close seen so far. It is the perfect first loop because you can check it by eye. We seed the first bar, then each later bar takes the larger of "this close" and "the running max up to the previous bar":
runMax = Close;                       // seed every bar with its own close
for( i = 1; i < BarCount; i++ )
{
    runMax[i] = Max( Close[i], runMax[i-1] );   // carry the max forward
}
Plot( runMax, "Running High", colorAqua, styleThick );
Trace it across six bars. The column that matters is runMax[i-1] - the answer the loop already wrote on the previous bar, feeding back in:
| Bar (i) | 0 | 1 | 2 | 3 | 4 | 5 |
|---|---|---|---|---|---|---|
Close[i] |
100 | 102 | 101 | 105 | 104 | 108 |
runMax[i-1] |
– | 100 | 102 | 102 | 105 | 105 |
runMax[i] |
100 | 102 | 102 | 105 | 105 | 108 |
Bar 2 is the moment it clicks: the close dropped to 101, but runMax stayed at 102 because Max(101, 102) keeps the higher previous result. The array is remembering. That feedback from runMax[i-1] into runMax[i] is the thing no plain array expression can do - and it is the whole reason loops exist.
A real trailing-stop loop
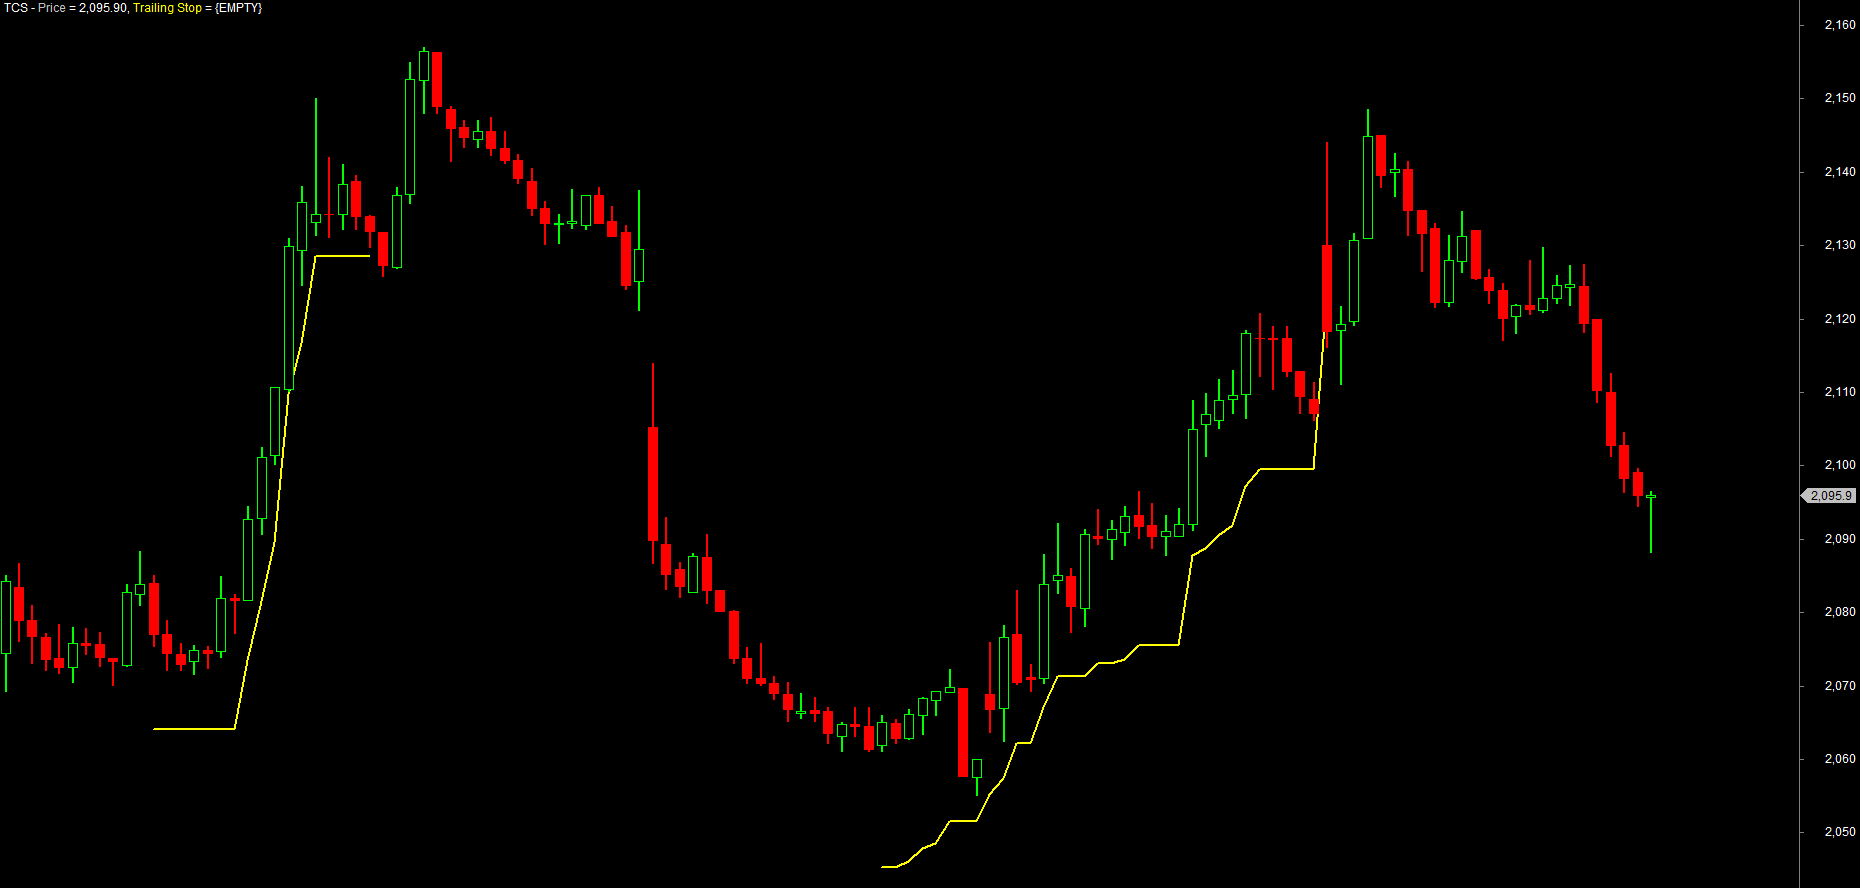
Now the example that truly earns the loop: a trailing stop. The plan in words: enter long on a signal, place a stop a set percent below the bar's high, ratchet that stop up as new highs print, and exit the instant price trades back through it. This is straight from the author's own Simple Trailing Stoploss.afl.
The piece that makes it work is one ordinary variable - trailstop - that keeps its value from one bar to the next. That is the state we carry across bars: 0 means "no trade open", and any positive number is the live stop level. We copy it into an array only at the end, so we can plot it.
_SECTION_BEGIN("Simple Trailing Stoploss");

slPct = Param("Trailing Stop %", 1, 0.25, 5, 0.25);   // stop distance, in percent

Buy  = Cross( MACD(), Signal() );    // fresh long entry - a MACD cross
Sell = 0;                            // the loop will fill Sell when the stop is hit

trailArray = Null;   // the level to PLOT - stays Null (invisible) while we are flat
trailstop  = 0;      // STATE carried across bars: 0 = no trade, > 0 = the live stop

for( i = 1; i < BarCount; i++ )
{
    // 1) a fresh Buy while flat -> set the initial stop below this bar's high
    if( trailstop == 0 AND Buy[i] )
        trailstop = High[i] * (1 - slPct/100);
    else
        Buy[i] = 0;                  // ignore repeat Buys while already long (acts like ExRem)

    // 2) stop hit? -> exit at the stop, then reset the state to hunt the next entry
    if( trailstop > 0 AND Low[i] < trailstop )
    {
        Sell[i]      = True;
        SellPrice[i] = trailstop;
        trailstop    = 0;
    }

    // 3) still long -> ratchet the stop up on new highs (never down), and record it
    if( trailstop > 0 )
    {
        trailstop     = Max( High[i] * (1 - slPct/100), trailstop );
        trailArray[i] = trailstop;
    }
}

Plot( Close, "Price", colorDefault, styleCandle );
Plot( trailArray, "Trailing Stop", colorYellow, styleThick );

_SECTION_END();
Read the loop as three moves on every bar. Set the stop when a fresh Buy arrives while flat (and blank out repeat Buys, exactly as ExRem would). Exit - and reset trailstop to 0 - if the bar's low pierces the stop. Trail: while still long, push the stop higher whenever a new high allows, because Max(...) lets it rise but never fall, and store the level in trailArray so it can be drawn. Because trailstop returns to 0 on every exit, the next Buy begins a brand-new stop - this is a true per-trade trailing stop, not a line that climbs forever.
The bug you may hit once and never forget: AFL is case-insensitive, so a variable named atr is the same name as the built-in ATR() function - atr = ATR(14); overwrites the function with your value and leads to baffling errors. Never name a variable after a built-in. Add a suffix instead: atrVal, myATR, atr14. The same caution applies to ma, rsi, sum, high and the rest.
Notice the professional split: the entry Buy = Cross(MACD(), Signal()) is computed the fast, array way before the loop, and the loop only does the one genuinely sequential job - carrying trailstop forward and testing whether it is hit. Keep the loop body small and let arrays do the rest. This very pattern - a state variable carried across bars - is the engine of the Supertrend you will build in the strategy module.
The while-loop: repeating an unknown number of times
A for-loop is the right tool when you know how many times to repeat - "once per bar." Its cousin the while-loop repeats as long as a condition stays true, which is what you want when you do not know the count in advance. Its shape is simply:
while( condition )
{
    // ... runs again and again until condition becomes false ...
}
The classic use inside AFL is an inner search: standing on bar i, walk backwards as far as some condition holds. Here we count the current run of consecutive higher closes - we have no idea how long the streak is, so a while is perfect:
upStreak = 0;                          // output array, all zeros
for( i = 1; i < BarCount; i++ )
{
    j = i;
    count = 0;
    // step back bar by bar while each close is higher than the one before it
    while( j > 0 AND Close[j] > Close[j-1] )
    {
        count = count + 1;
        j = j - 1;
    }
    upStreak[i] = count;
}
Plot( upStreak, "Up Streak", colorGreen, styleHistogram );
Trace the streak. Each time a close is lower than the one before, the run breaks and the count falls back to 0:
| Bar | 1 | 2 | 3 | 4 | 5 | 6 | 7 |
|---|---|---|---|---|---|---|---|
Close |
100 | 102 | 103 | 101 | 104 | 105 | 106 |
upStreak |
0 | 1 | 2 | 0 | 1 | 2 | 3 |
At bar 3 the while ran twice (103 > 102, then 102 > 100) before stopping, giving a streak of 2. At bar 4 the close fell, so the while never ran at all and the streak is 0. The number of times the inner loop spins is different on every bar - and that is precisely when you reach for while instead of for.
Every while-loop must contain something that eventually makes its condition false - here, j = j - 1 marches j toward 0. Forget that step and the condition stays true forever: an infinite loop that freezes AmiBroker. Always make sure each pass moves you closer to the exit.
Performance and good habits
A loop in AFL is dramatically slower than the equivalent array operation, because the array engine is heavily optimised and a hand-written loop is not. On a single chart you will never notice. But run a loop-heavy formula across a 2,000-symbol watchlist in the Analysis window and the difference between "instant" and "go make tea" is real. A few habits keep loops cheap and correct:
- Prefer arrays. If a built-in function or an array expression can do it, use that. Reach for a loop only for true previous-result dependencies.
- Initialise the output array first. Set
myArray = Null;(or0) before the loop so every bar has a defined starting value and the array is the right length. - Compute heavy inputs outside the loop. Call
ATR,EMAand friends once, before the loop, and index their results inside - never recalculate an indicator bar by bar. - Mind the boundaries. Start at
i = 1when you readi-1; never readi+1in a signal.
A good test of whether you need a loop: try to write the rule with Ref(..., -1) and array maths. If Ref on the input arrays is enough, you do not need a loop. Only when you need Ref on the output you are still building does the loop become unavoidable.
Try it yourself
- Run the trailing-stop loop on NSE RELIANCE, then change the Trailing Stop % from 1 to 0.5 and watch the stop hug price more tightly.
- Swap the
Maxin step 3 for a plain assignment (trailstop = High[i] * (1 - slPct/100)) and watch the stop loosen on pullbacks - proof of why the ratchet matters. - Add
PlotShapes( IIf(Sell, shapeDownArrow, shapeNone), colorRed, 0, High, -20 );and confirm a Sell prints exactly where the low pierces the stop. - Write a tiny loop that counts consecutive up-closes, resetting to 0 on any down close, carrying the count in a state variable.
Recap
- Arrays handle almost everything; a loop is needed only when a bar depends on the previously computed result (trailing stops, Supertrend, state).
- The form is
for( i = 0; i < BarCount; i++ ), withias the current bar andarray[i]/array[i-1]to index single bars. - Carry state across bars either by reading
array[i-1]of the array you are filling, or with a plain variable (liketrailstop) that keeps its value between iterations. - Always initialise the output array and seed bar 0 before the loop; start at
i = 1when you look one bar back. - Compute indicators with arrays before the loop, and keep the loop body small - loops are slow, so use them sparingly.
Next we package logic we reuse - turning a working snippet into our own named function we can call again and again.