The Title Bar & StrFormat
Build a rich, dynamic chart header - name, OHLC, percent change - with Title, StrFormat and WriteIf.
- ·The Title variable
- ·StrFormat & format specifiers
- ·{{NAME}}, {{DATE}} tokens
- ·NumToStr & WriteIf
- ·SelectedValue for the cursor
- ·A professional header
Look at the very top of any AmiBroker chart and you will see a line of text - the symbol name, the date, the open, high, low and close. That line is not decoration. It is a small, live read-out that you control completely from AFL, and a good one tells you everything you need to know about a bar without ever leaving the chart. In this chapter we build that header from scratch.
The tool that makes it possible is StrFormat - a function that stitches numbers and text into a single tidy string. Master it once and you will reuse it in titles, on-chart labels, exploration columns and dashboards for the rest of the course.
The Title variable
Title is a special built-in string variable. Whatever you assign to it becomes the text shown in the chart's title bar. The simplest possible version is just a piece of text:
Title = "Hello from AFL";
That is correct but useless - it never changes. The power comes when you weave in values that update bar by bar as you move the cursor. To do that we need a way to glue text and numbers together, and that is StrFormat.
You will almost always see the title wrapped as _N( Title = StrFormat(...) ). The _N() wrapper simply tells AmiBroker "this is a string expression, leave it alone" so it is not mistaken for a number. Copy the pattern; you do not need to understand the internals to use it.
StrFormat and format specifiers
StrFormat works like a fill-in-the-blanks sentence. You write a template string with little placeholders called format specifiers, then list the values that fill those blanks, in order. Each specifier starts with a %:
%g- a "general" number; shows a sensible number of digits and drops trailing zeros. Great for prices.%.2f- a fixed-point number with exactly 2 decimals (24875.40). Change the2to control decimals.%.1f%%- one decimal, followed by a literal percent sign. You write%%to print a real%.
// Pull a few values, then format them into one string
ema20  = EMA( Close, 20 );
change = ROC( Close, 1 );   // 1-bar percent change

line = StrFormat( "Close %.2f  EMA20 %.2f  Change %.1f%%",
                  Close, ema20, change );

Title = line;
The blanks are filled left to right: the first %.2f takes Close, the second takes ema20, and %.1f%% takes change. The count and order must match, or the numbers land in the wrong slots.
%g is the friendliest specifier for everyday use - it adapts to the number. Use %.2f when you want columns to line up neatly (a stop and a target with the same decimals), and %g when you just want the value shown cleanly.
The chart tokens
AmiBroker also understands a handful of double-brace tokens inside a title string. These are not format specifiers - they are shortcuts the charting engine fills in for you:
{{NAME}}- the symbol's ticker (RELIANCE, NIFTY, BANKNIFTY).{{DATE}}- the date of the bar under the cursor.{{INTERVAL}}- the timeframe (Daily, 5-minute, and so on).{{VALUES}}- the values of every other indicator plotted on the chart, in their own colours.
Drop them straight into the template text and they expand automatically. This is why the standard header looks the way it does.
The standard header line
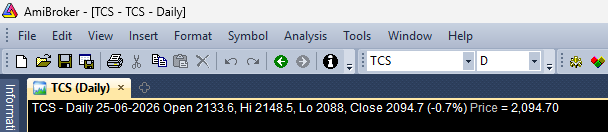
Open almost any teaching formula and you will find this exact line near the top. It is the house-standard header, and it is worth learning by heart:
_N( Title = StrFormat(
    "{{NAME}} - {{INTERVAL}} {{DATE}} Open %g, Hi %g, Lo %g, Close %g (%.1f%%) {{VALUES}}",
    O, H, L, C, SelectedValue( ROC( C, 1 ) ) ) );
Read it slowly. The tokens supply the name, interval and date. The four %g blanks are filled by O, H, L, C - the open, high, low and close arrays. The (%.1f%%) blank is filled by the one-bar percent change. And {{VALUES}} tacks on any other indicators you have plotted. The result is the familiar professional header you see in every screenshot in this course.
SelectedValue: the value under the cursor
Here is the subtle part. O, H, L, C are arrays - one value per bar. But the title is a single line of text. Which bar's values should it show? The answer: the bar you have clicked or hovered, the selected bar.
SelectedValue( array ) reaches into an array and pulls out the one value at the selected bar. In the header above, SelectedValue( ROC(C,1) ) gives the percent change of whichever bar your cursor is on. As you scrub across the chart, the header updates. Notice the OHLC values do not need wrapping - when you pass a full array to StrFormat in a title, AmiBroker automatically shows the selected bar's value. Use SelectedValue explicitly when you compute something and want to be certain you are reading the cursor bar.
A title shows one bar at a time: the selected bar. Arrays passed to a StrFormat title are read at that bar automatically. When in doubt, wrap your value in SelectedValue() to be explicit about reading "the value under the cursor".
NumToStr and WriteIf
Sometimes you want a number as plain text outside of StrFormat. NumToStr( value, format ) does exactly that, using the same 1.2-style format codes you will meet in explorations (1.2 means two decimals):
slText = "Stop: " + NumToStr( Close * 0.99, 1.2 );
And when the text itself should change with a condition, WriteIf( condition, "ifTrue", "ifFalse" ) is the string version of an if/else:
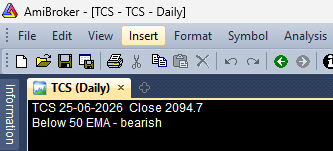
trendUp  = Close > EMA( Close, 50 );
regime   = WriteIf( trendUp, "Above 50 EMA - bullish", "Below 50 EMA - bearish" );

_N( Title = StrFormat( "{{NAME}} {{DATE}}  Close %g\n", C ) + regime );
The \n inside the string starts a new line, so the regime text sits on a second row of the title. Combining StrFormat, NumToStr and WriteIf lets you build a header that reads like a sentence: "BANKNIFTY 5-minute, close 48,210, above the 50 EMA - bullish."
WriteIf returns text (for titles and labels). Its cousin IIf returns numbers (for colours and values). Same idea, two flavours: WriteIf when you want words, IIf when you want numbers.
Try it yourself
- Paste the standard header line onto a chart, then click different bars and watch the OHLC and percent change follow your cursor.
- Change the four
%gspecifiers to%.2fand see how the prices gain fixed decimals. - Add a second line with
\nthat usesWriteIfto print "RSI overbought" whenRSI(14) > 70, else "RSI normal". - Replace
ROC(C,1)withSelectedValue( RSI(14) )and show the live RSI value in the header.
Recap
Titleis a string variable; assign text to it and it appears in the chart header.StrFormatglues text and numbers using specifiers -%gfor clean numbers,%.2ffor fixed decimals,%%for a literal percent.- The tokens
{{NAME}},{{INTERVAL}},{{DATE}}and{{VALUES}}are filled in by the chart engine. SelectedValuereads the value under the cursor; titles show the selected bar.NumToStrturns a number into text, andWriteIfchooses text by condition.
Next we leave a single symbol behind and pull in another one - reading the index alongside your stock to build relative-strength and ratio charts.