Filtering, Sorting & Ranking
Sort the results, colour the cells, and rank your universe by strength or volume.
- ·Multi-condition filters
- ·Sorting columns
- ·Conditional cell colour
- ·Relative-volume ranking
- ·Highlighting the best
- ·Exploration as a daily routine
A raw scan gives you a list. A good scan gives you a list that is already sorted by what matters, with the strongest names jumping out in green and the weak ones fading into red - so your eye lands on the right row in a second. That polish is the difference between a screener you check once and one you build your whole morning routine around.
AddColumn's format code (1.2 means one leading digit, two decimals) is the same number-formatting used throughout AFL - and you can colour any cell by passing a text and background colour after it.
In this chapter we layer three finishing touches onto explorations: richer multi-condition filters, sorting, and conditional cell colour - then put them together to rank a universe by relative volume.
Multi-condition filters: AND and OR
A single condition is rarely a setup. Real screens combine several. AND requires all parts to be true; OR requires any. You can mix them, using parentheses to keep the logic clear.
// A quality breakout: new high AND strong trend AND above-average volume
newHigh   = High > Ref( HHV( High, 50 ), -1 );
inUptrend = Close > EMA( Close, 50 );
heavyVol  = Volume > 1.5 * MA( Volume, 20 );

Filter = newHigh AND inUptrend AND heavyVol;
Every row that survives this filter is a stock at a 50-bar high, above its 50-EMA, on volume at least 1.5x its 20-day average. Three loose conditions become one sharp setup. Use OR when you want alternatives - "RSI oversold OR price below the lower band" - and wrap each side in parentheses so the precedence is unambiguous:
Filter = ( RSI( 14 ) < 30 ) OR ( Close < BBandBot( Close, 20, 2 ) );
Build complex filters one condition at a time. Start with Filter = newHigh;, check the count, then add AND inUptrend, check again. If the list suddenly empties, the last clause you added is too strict - you will know exactly which one.
Sorting the results
Once you have the right rows, order them by what you care about. There are two ways:
- Click a column heading in the results grid to sort by it - click again to reverse. Quick and interactive.
- Default-sort in code with
SetSortColumns, so the table always opens in a useful order. A positive number sorts that column ascending; a negative number sorts it descending. The number is the column position (1 is the symbol, 2 is your firstAddColumn, and so on).
Filter = 1;
AddColumn( Close, "Close", 1.2 ); // column 2
AddColumn( RSI( 14 ), "RSI", 1.2 ); // column 3
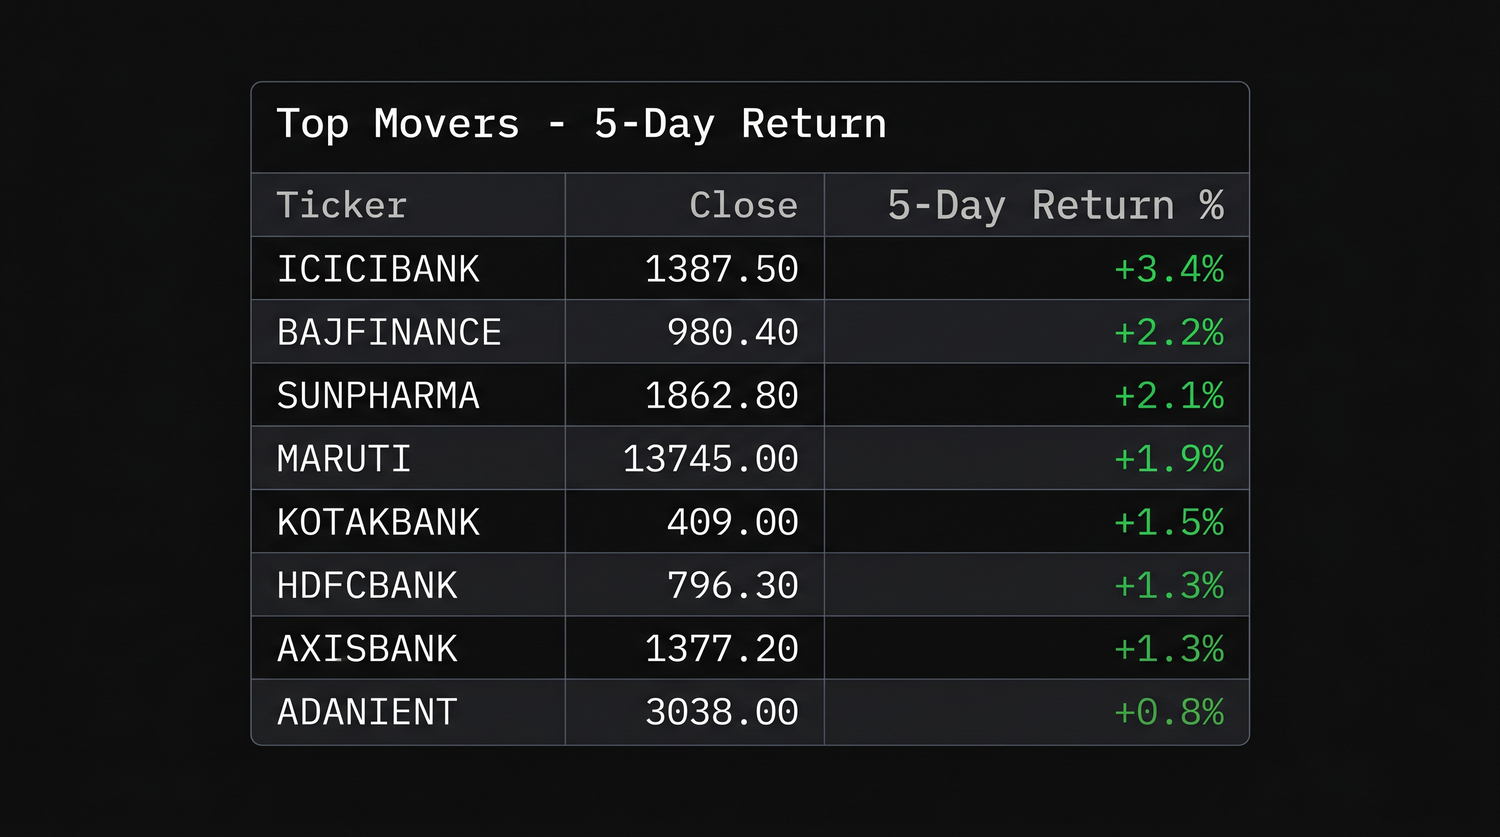
AddColumn( ROC( Close, 5 ), "5d Ret%", 1.2 ); // column 4
SetSortColumns( -4 ); // open sorted by 5-day return, strongest first
The negative -4 means "sort by column 4, descending", so the biggest five-day gainers sit at the top the moment the scan finishes - no clicking required.
Conditional cell colour
Colour is the fastest signal your eye can read. AddColumn accepts two extra arguments - a text colour and a background colour - and because they accept arrays, you can colour each cell by its own value:
AddColumn( value, "Heading", 1.2, textColor, bkColor );
Feed those colours from an IIf so the cell paints itself:
chg = ROC( Close, 1 );

// green text when up on the day, red when down
chgColor = IIf( chg > 0, colorGreen, colorRed );

Filter = 1;
AddColumn( Close, "Close", 1.2 );
AddColumn( chg, "Change %", 1.2, chgColor );   // text colour follows the sign
For a stronger highlight, colour the background instead. Here we shade the whole RSI cell - red when overbought, green when oversold, neutral grey otherwise:
r = RSI( 14 );

bk = IIf( r > 70, colorRed,
     IIf( r < 30, colorGreen, colorDarkGrey ) );

AddColumn( r, "RSI", 1.2, colorWhite, bk );  // white text on a coloured background
The fifth argument is the background; the fourth is the text colour. Pair a light text colour with a dark background (and vice versa) so the numbers stay readable.
AddColumn( value, "name", 1.2, textColor, bkColor ) - the last two arguments accept arrays, so an IIf paints each cell by its own value. Colour the background for a strong highlight, the text for a subtle one.
Ranking by relative volume
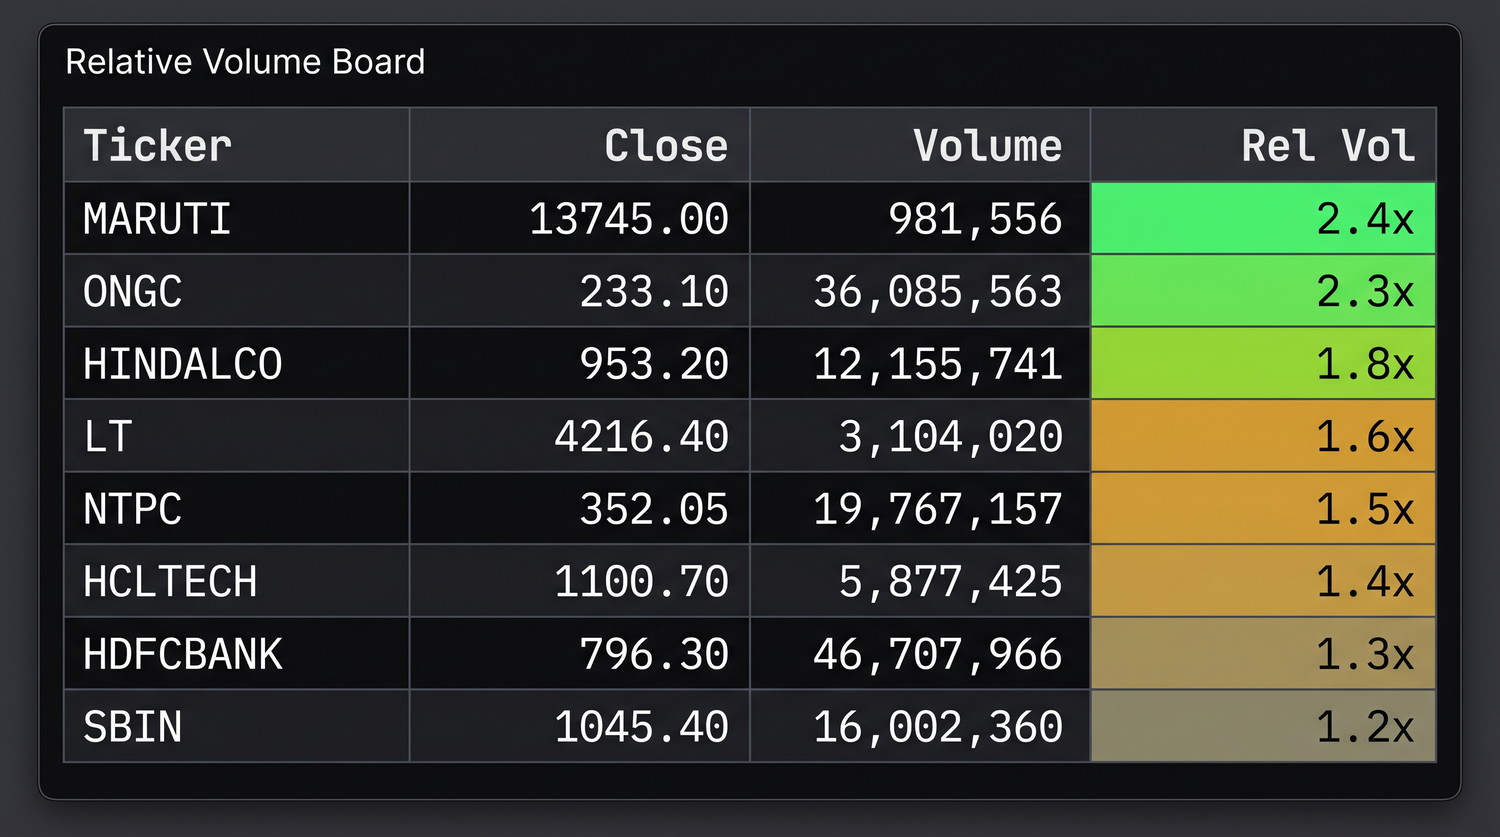
Now we combine everything into a screen traders actually run every day: relative volume, which measures how busy a stock is compared to its own normal. A value of 2 means twice the usual activity - often the first sign that something is happening.
_SECTION_BEGIN( "Relative Volume Ranking" );

relVol = Volume / MA( Volume, 20 );   // today's volume vs its 20-day average

// only stocks trading at least 1.5x their normal volume
Filter = relVol > 1.5;

// colour the relative-volume cell by how extreme it is
rvColor = IIf( relVol > 3, colorRed,
          IIf( relVol > 2, colorOrange, colorYellow ) );

AddColumn( Close,           "Close",    1.2 );
AddColumn( relVol,          "Rel Vol",  1.2, colorBlack, rvColor );
AddColumn( ROC( Close, 1 ), "Change %", 1.2,
           IIf( ROC( Close, 1 ) > 0, colorGreen, colorRed ) );

SetSortColumns( -3 );  // most active names at the top (column 3 = Rel Vol)

_SECTION_END();
Read what this does end to end: the Filter keeps only unusually active stocks, the relVol column is shaded yellow-to-red by intensity, the change column is green or red by direction, and SetSortColumns(-3) floats the busiest names to the top. That is a complete, glanceable "what is moving today" board from a dozen lines of AFL.
Relative volume travels well. Bolt the same Volume / MA(Volume,20) column onto your breakout or MACD scanners from the last chapter and you instantly see which signals come with real participation behind them.
Exploration as a daily routine
The point of all this polish is repeatability. A well-built exploration becomes a fixed part of your day:
- Save it as an
.apxproject (from the last chapter) so the formula, watchlist and range come back together. - Open it before the session, press Explore, and read the top of a pre-sorted, pre-coloured list.
- Keep a small library of these - a breakout board, an oversold-bounce board, a relative-volume board - each one a saved project.
Colour and sorting make a list persuasive, which is exactly why you should keep the underlying conditions honest. A beautifully shaded table of a curve-fit setup is still a curve-fit setup. Let the filter earn its place first; add the polish second.
Try it yourself
- Take your MACD scanner and add
SetSortColumnsto open it sorted by the MACD histogram value. - Colour a "Close vs 50-EMA" column green when above and red when below.
- Build the relative-volume board and watch which names light up red after a news day.
- Combine three conditions with
AND, then loosen the strictest one toORand watch the count change.
Recap
- Combine conditions with
AND(all) andOR(any); parenthesise to keep precedence clear. - Sort by clicking a heading, or set a default order in code with
SetSortColumns(negative = descending). AddColumn( value, "name", 1.2, textColor, bkColor )colours cells; feed the colours fromIIfto paint by value.- Relative volume (
Volume / MA(Volume,20)) ranks unusual activity - filter, colour and sort it into a daily board. - Save your best screens as projects and let polished, honest explorations drive your routine.
That closes the Exploration module. Next we step up from spotting setups to trading them - meeting the four reserved arrays, Buy, Sell, Short and Cover, that turn an idea into a system.