Built-in Functions & Indicators
A guided tour of the functions you will use every day - MA, EMA, RSI, MACD, ATR, BBands and how to read the function reference.
- ·Moving averages: MA, EMA, WMA
- ·RSI, MACD, Stochastic
- ·ATR & Bollinger Bands
- ·Sum, Highest, Lowest, HHV, LLV
- ·Reading the AFL function reference
- ·Nesting functions
You have already used a handful of built-in functions - RSI, MA, EMA, MACD, BBandTop. Each one packs a whole calculation into a single word, hands you back a finished array, and saves you from reinventing a wheel that thousands of traders rely on. AmiBroker ships hundreds of these. You do not need all of them; you need to know the two dozen that do real work every day, and how to look up the rest. This chapter is that guided tour, plus the skill of reading the official reference so you are never stuck.
AmiBroker ships with several hundred built-in AFL functions. The official function reference lists every one with its arguments - it is the manual that every AFL coder keeps open in a browser tab.
What a built-in function really is
Think of a function as a labelled machine: you feed it some arrays and numbers (its arguments), it does its calculation across every bar, and it returns a brand-new array. RSI(14) takes a period and returns the RSI column. MA(Close, 20) takes a price array and a period and returns the moving-average column. The shape is always the same - arguments in, array out - and because the result is an array, you can plot it, compare it, or feed it straight into another function.
Moving averages: MA, EMA, WMA
The three you will reach for constantly:
MA(array, period)- simple moving average; every bar in the window counts equally.EMA(array, period)- exponential moving average; recent bars weigh more, so it turns faster.WMA(array, period)- weighted moving average; a linear weighting between the two.
sma20 = MA(Close, 20);    // smooth, slow to react
ema20 = EMA(Close, 20);   // same period, but hugs price more closely
wma20 = WMA(Close, 20);   // a middle ground
All three take any array as their first argument, not just Close. That is the quiet power of AFL: EMA(Volume, 20) is an average volume, MA(High, 10) smooths the highs. The function does not care where the array came from.
Watch a moving average form
MA(Close, 3) averages the last three closes, so the first two bars come back blank - there simply is not enough data yet to fill a three-bar window. From bar 3 onward each value is the average of that bar and the two before it, which is exactly why a moving average both lags and smooths:
| Bar | 1 | 2 | 3 | 4 | 5 | 6 |
|---|---|---|---|---|---|---|
Close |
100 | 102 | 98 | 104 | 103 | 107 |
MA(Close, 3) |
– | – | 100.00 | 101.33 | 101.67 | 104.67 |
The average line is smoother and a step behind price - that lag is the price you pay for filtering out noise. An EMA reacts faster because it weights the most recent bars more heavily, but the same blank-then-fill idea applies.
Momentum: RSI, MACD and Signal
RSI(period)- the Relative Strength Index, 0 to 100, measuring momentum. Called with no argument it defaults to 14.MACD(fast, slow)- returns the MACD line (the difference between a fast and slow EMA). Defaults are 12 and 26.Signal(fast, slow, signal)- returns the signal line (an EMA of the MACD line). Defaults 12, 26, 9.
The MACD and its signal are designed to be read together - the classic cross of one over the other, straight from the author's scanner code:
_SECTION_BEGIN("MACD & Signal");

macdLine   = MACD(12, 26);          // the MACD line
signalLine = Signal(12, 26, 9);     // its 9-period signal line

Plot(macdLine,   "MACD",   colorWhite, styleThick);
Plot(signalLine, "Signal", colorRed,   styleThick);
Plot(0, "", colorLightGrey, styleDashed);   // zero reference

// MACD above its signal = bullish momentum
bullish = macdLine > signalLine;

_SECTION_END();
That last line, macdLine > signalLine, produces a true/false array - the seed of a signal, exactly as Chapter 3 promised.
Volatility & bands: ATR, BBandTop, BBandBot
ATR(period)- the Average True Range, a measure of how much a symbol moves per bar in price terms. The backbone of sensible stops and the Supertrend.BBandTop(array, period, width)- the upper Bollinger Band.BBandBot(array, period, width)- the lower Bollinger Band.
iatr  = ATR(14);                       // average true range over 14 bars
upper = BBandTop(Close, 20, 2);        // 20-period band, 2 std deviations
lower = BBandBot(Close, 20, 2);
ATR is in the same units as price, so a 14-period ATR of 18 on NSE RELIANCE means the stock typically travels about 18 rupees a bar - precisely what you want when sizing a stop that is neither too tight nor too loose.
Aggregations: Sum, Highest, Lowest, HHV, LLV
This family answers "over the last N bars, what was the...?" questions:
Sum(array, period)- rolling total over the lastperiodbars.HHV(array, period)- Highest High Value over the window.LLV(array, period)- Lowest Low Value over the window.Highest(array)/Lowest(array)- the highest/lowest value so far across all bars.
// a Donchian channel - the highest high and lowest low of the last 20 bars
upper = HHV(High, 20);
lower = LLV(Low, 20);

// a 52-week high/low on daily bars (about 250 trading days)
high52 = HHV(High, 250);
low52  = LLV(Low, 250);

// average volume of the last 20 bars, built from Sum
avgVol = Sum(Volume, 20) / 20;
These are the building blocks of breakout systems and 52-week-high scanners - you will see them again in Module D and the strategy playbook.
Most "indicators" are just these primitives combined. A Donchian breakout is HHV/LLV. A Supertrend is ATR plus a loop. Bollinger Bands are a moving average plus standard deviation. Learn the primitives and you can read - and build - almost anything.
Nesting functions
Because every function returns an array, and every function accepts an array, you can feed one straight into another - nesting them. This is where AFL becomes expressive:
smoothRSI = EMA(RSI(14), 5); // a 5-bar EMA of the 14-bar RSI - a calmer RSI
Read it inside-out, like algebra: AFL computes RSI(14) first, producing an RSI column, then EMA(..., 5) smooths that column. The author's Smooth RSI.afl does exactly this to tame RSI's jitter. You can nest several deep - MA(Highest(Close), 10) and the like - but a good habit is to stop when a line stops being readable and split it into named steps instead:
rs        = RSI(14);
smoothRSI = EMA(rs, 5);   // same result, easier to read and debug
When a nested line gets hard to read, break it into named variables. The computer does not care, but the next human does - and naming the intermediate step often reveals a bug you would have missed buried inside the brackets.
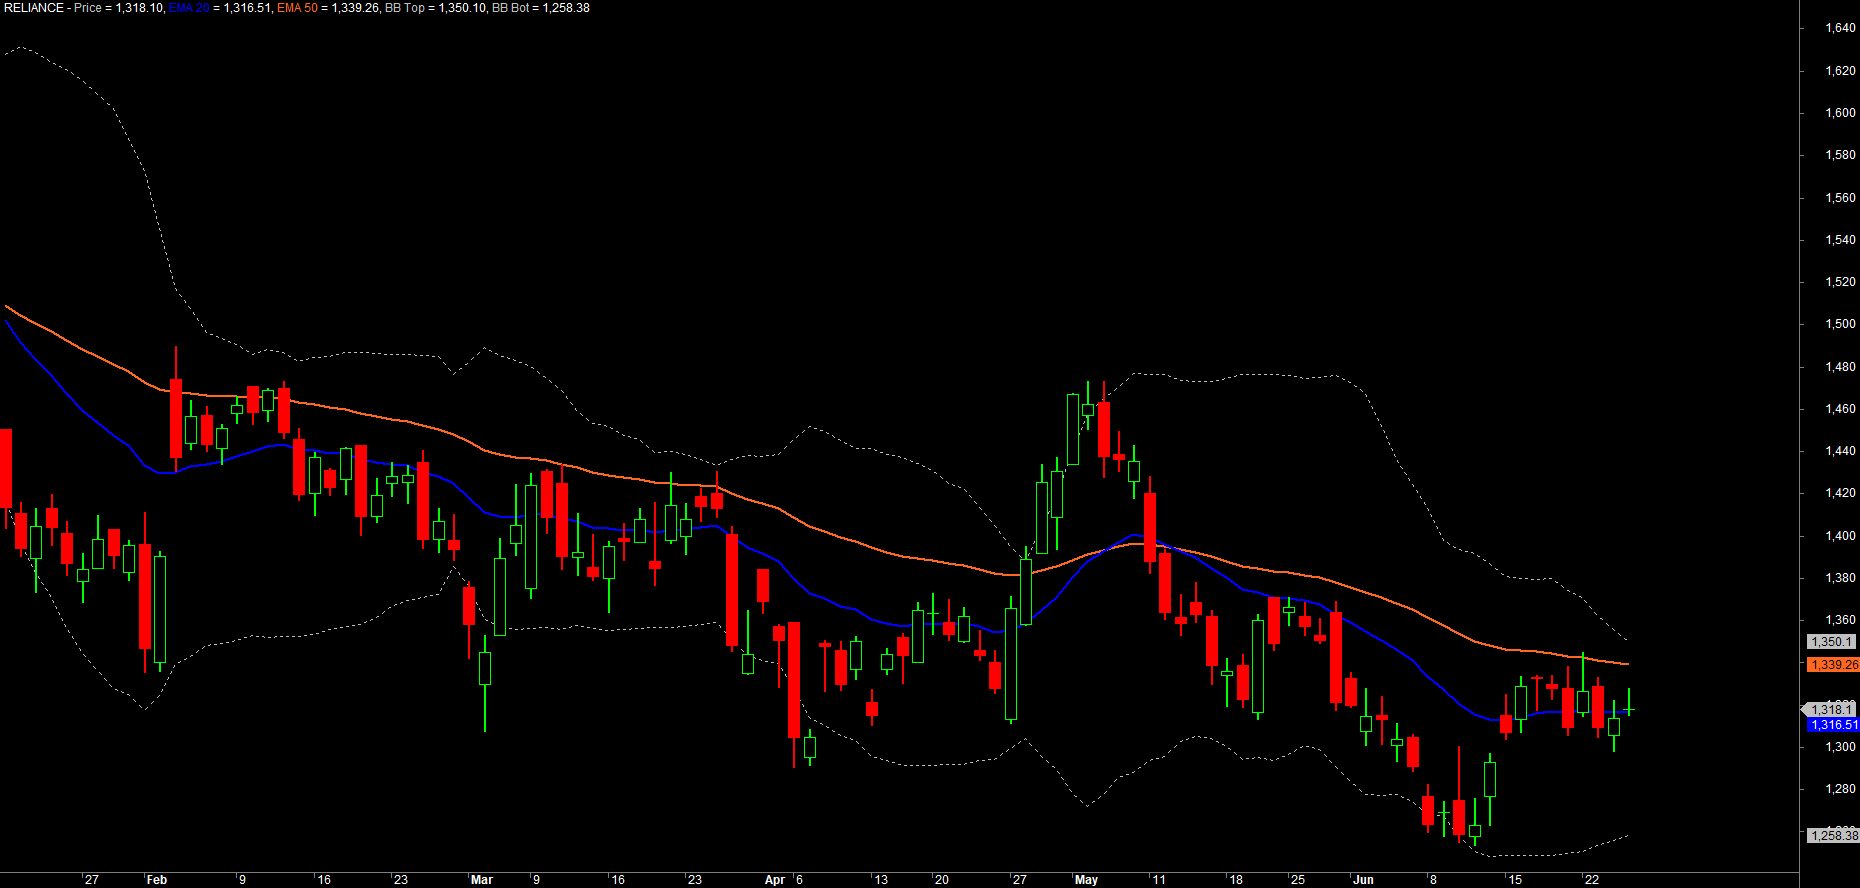
Here is a small chart combining a few of these into something useful:
_SECTION_BEGIN("Function Tour");

Plot(Close, "Price", colorDefault, styleCandle);

// trend: two moving averages
Plot(EMA(Close, 20), "EMA 20", colorBlue,  styleThick);
Plot(EMA(Close, 50), "EMA 50", colorOrange, styleThick);

// volatility envelope: Bollinger Bands
Plot(BBandTop(Close, 20, 2), "BB Top", colorLightGrey, styleDashed);
Plot(BBandBot(Close, 20, 2), "BB Bot", colorLightGrey, styleDashed);

_SECTION_END();
Reading the official function reference
No one memorises every argument. The skill that lasts is knowing how to look it up. AmiBroker's official Function Reference at amibroker.com/guide lists every function alphabetically, and each entry tells you four things:
- The SYNTAX line - the function name and the order of its arguments, with defaults shown.
- What each argument means and its allowed range.
- What the function returns (and crucially, whether it returns an array).
- A short example you can copy and adapt.
So when you read MA(array, periods) in the reference, you know instantly that the array comes first and the period second - never the other way around. Inside the Formula Editor you also get help locally: hover or use the built-in Functions pane, and AmiBroker shows the same syntax hint.
A function's defaults are your friend. RSI() assumes 14, MACD() assumes 12 and 26, Signal() assumes 12, 26, 9. Writing RSI() and RSI(14) give the same result. The reference always shows which arguments are optional - lean on the sensible defaults until you have a reason to change them.
Try it yourself
- Plot
MA(Close, 20),EMA(Close, 20)andWMA(Close, 20)together. Which reacts fastest to a sharp move on BANKNIFTY? - Build a Donchian channel with
HHV(High, 20)andLLV(Low, 20), overlay it on candles, and watch price break out of it. - Plot
RSI(14)andEMA(RSI(14), 5)in the same pane to see how nesting smooths the signal. - Look up
StDevin the function reference, then rebuild the upper Bollinger Band yourself asMA(Close, 20) + 2 * StDev(Close, 20)and confirm it matchesBBandTop(Close, 20, 2).
Recap
- A built-in function takes arguments and returns a finished array - "arguments in, array out".
- Moving averages:
MA(simple),EMA(exponential, faster),WMA(weighted) - all accept any array. - Momentum:
RSI;MACD()returns the MACD line,Signal()returns its signal line - read them together. - Volatility & bands:
ATR(range in price units),BBandTop/BBandBot. - Aggregations:
Sum,HHV,LLV,Highest,Lowestanswer "over the last N bars" questions. - Nest functions by feeding one's array into another (
EMA(RSI(14), 5)); split long nests into named steps for clarity. - The official Function Reference (amibroker.com/guide) shows each function's syntax, arguments, return value and defaults - learn to read it.
Next, we move from describing the market to making decisions about it - comparisons, AND/OR logic, and the all-important IIf that chooses a value bar by bar.