Conditions, Logic & IIf
Build true/false arrays with comparisons and AND/OR, then choose values bar-by-bar with the all-important IIf.
- ·Comparison operators
- ·AND, OR, NOT on arrays
- ·True/false as 1/0
- ·IIf(condition, a, b)
- ·Nesting IIf
- ·Common logic mistakes
Up to now your formulas have calculated things - an average, an RSI, a band. But a trading idea is rarely "what is the value?" It is almost always "is this true right now?" Is the price above its moving average? Is RSI below 30? Has volume spiked? The moment you ask a yes/no question of the chart, you have stepped into the world of conditions and logic - and it is where indicators start turning into decisions.
In AFL, true and false are simply the numbers 1 and 0. That is why you can literally add up signals - Sum(Buy, 20) counts how many buy signals fired in the last 20 bars.
The wonderful thing is that AFL handles this exactly the way it handles everything else: as arrays. A comparison does not return one yes/no answer - it returns a whole column of yes/no answers, one for every bar. Get comfortable with that picture and the rest of this chapter falls into place.
Comparisons build true/false arrays
The comparison operators are the ones you already know from school maths:
>greater than,<less than>=greater-or-equal,<=less-or-equal==equal to (note the double equals),!=not equal to
When you compare two arrays, AFL walks down them bar by bar and asks the question at each bar. The answer at every bar is either true or false:
// Is the close above its 50-period EMA? One answer per bar.
upTrend = Close > EMA(Close, 50);
upTrend is now an array exactly as long as the chart. On bars where the close sat above the average it holds true; everywhere else it holds false. Nothing has been drawn yet - we have simply built a column of yes/no flags that we can use however we like.
In AFL, true is just the number 1 and false is just the number 0. A condition is an array of 1s and 0s. This single fact is the secret behind half the clever tricks you will ever see in AFL - you can add them, multiply them, and average them like any other numbers.
Because true and false are really 1 and 0, you can do arithmetic with conditions. Want to know how many of the last 20 bars closed up? Sum the flags:
upBar    = Close > Ref(Close, -1);   // 1 on up days, 0 on down days
upCount  = Sum(upBar, 20);           // how many up days in the last 20
That is a genuinely useful breadth measure, and it fell out of treating a yes/no question as a number.
Combining conditions with AND, OR, NOT
Real setups usually have more than one rule. AFL joins conditions with three plain-English operators:
AND- both sides must be trueOR- either side is enoughNOT- flips true to false and back
These also work array-by-array, so the combined result is again a column of 1s and 0s:
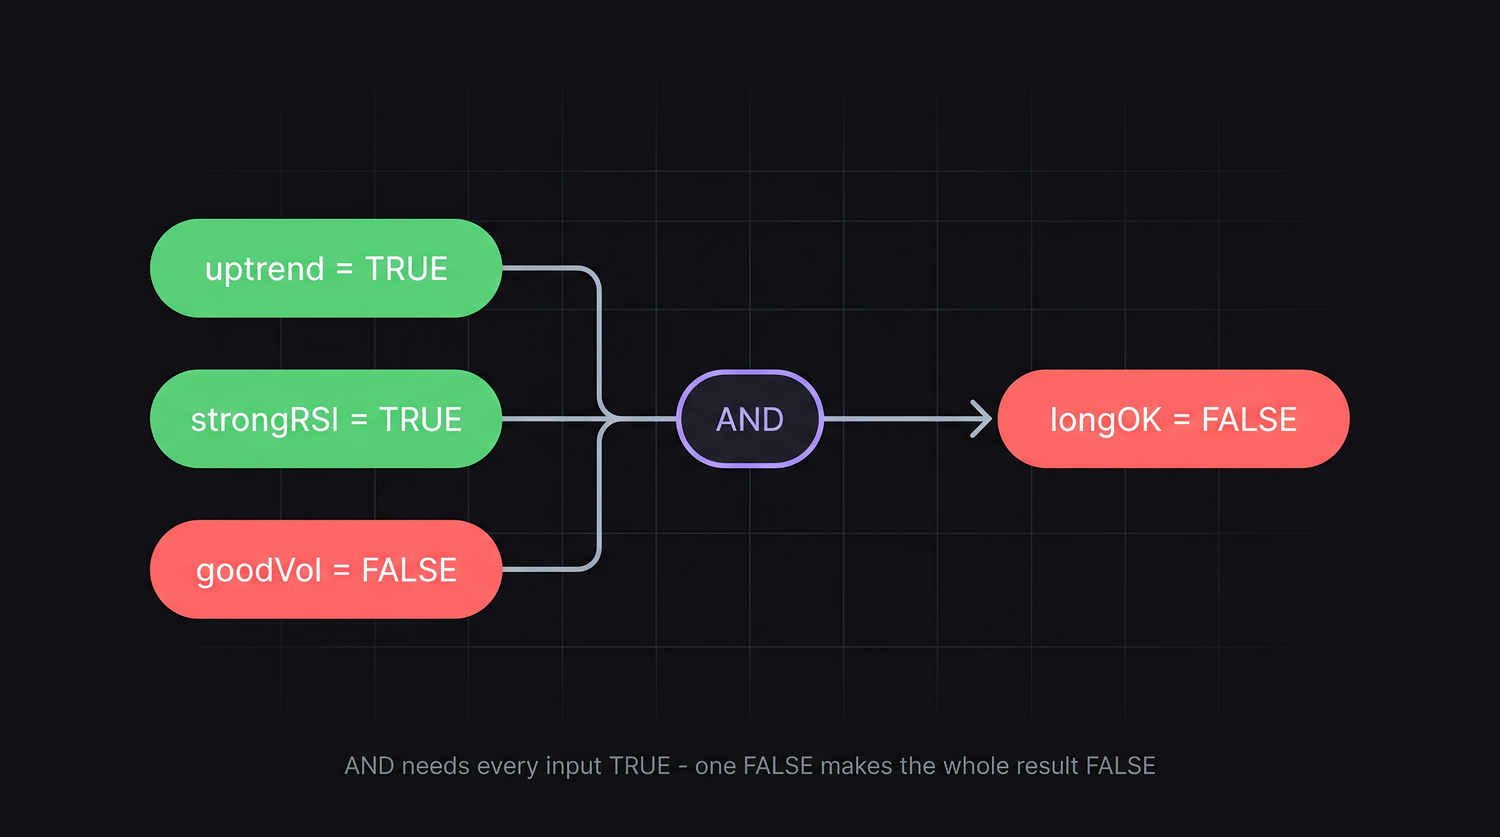
// A simple long filter: uptrend AND momentum AND real volume
upTrend   = Close > EMA(Close, 50);
strongRSI = RSI(14) > 50;
goodVol   = Volume > MA(Volume, 20);

longOK = upTrend AND strongRSI AND goodVol;   // true only when all three agree
longOK is true on a bar only when all three pieces are true on that bar. Swap AND for OR and you would flag a bar where any of them is true - a much looser net. NOT is handy for "the opposite of":
sideways = NOT upTrend AND NOT (Close < EMA(Close, 50)); // neither clearly up nor down
AmiBroker also accepts the symbols && for AND, || for OR and ! for NOT, so upTrend && strongRSI means the same as upTrend AND strongRSI. The word forms read more naturally in beginner code, so we use them throughout this course.
IIf: choosing a value per bar
Conditions tell you whether something is true. Very often you then want to pick one value when it is true and another when it is false. That is the job of IIf - "Inline If" - the most-used decision function in all of AFL:
IIf( condition, valueIfTrue, valueIfFalse )
It marches down the three arrays together and, at every single bar, looks at condition: if that bar is true it takes the value from the second argument, otherwise it takes the value from the third. The classic use is colour - paint the chart by a rule:
upTrend  = Close > EMA(Close, 50);

// green where the trend is up, red where it is not - decided bar by bar
barColor = IIf(upTrend, colorGreen, colorRed);

Plot(Close, "Price", barColor, styleCandle);
Run that and the candles light up green while price holds above the average and switch to red the moment it drops below. You have not changed the price at all - only its colour - and the chart now tells a story at a glance.
IIf is not only for colours. It returns whatever you feed it - a colour, a number, an array:
// stop sits below the low in an uptrend, above the high otherwise
stopLevel = IIf(upTrend, Low - ATR(14), High + ATR(14));
Plot(stopLevel, "Stop", colorOrange, styleDashed);
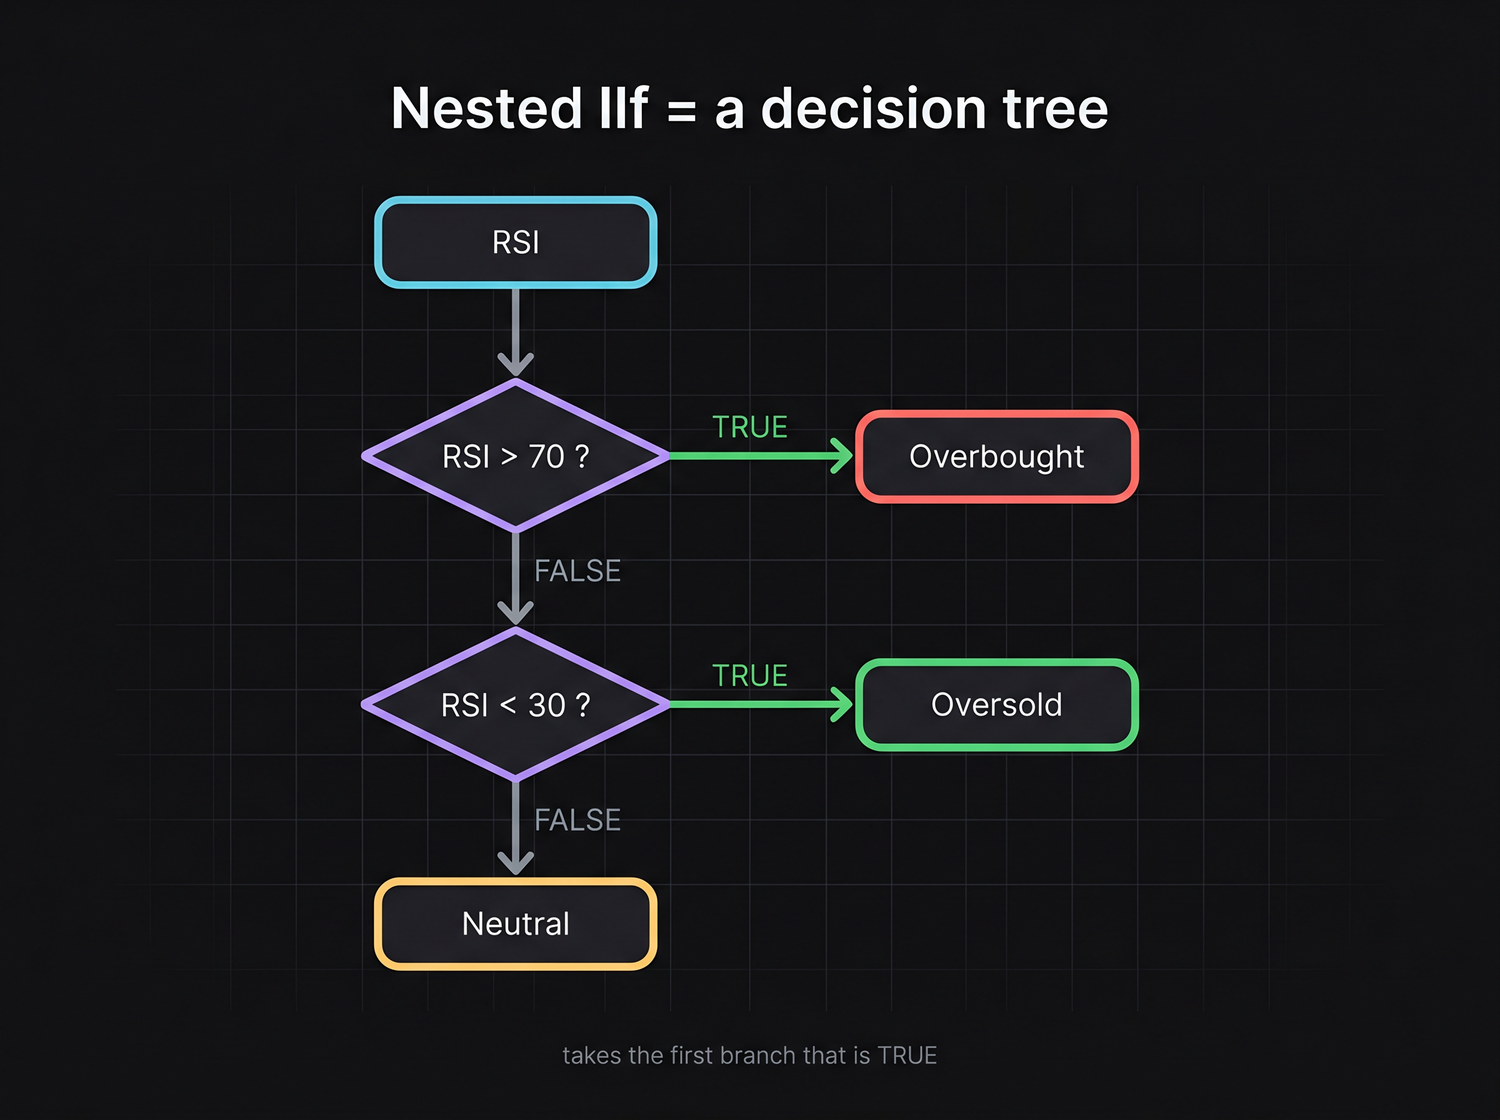
Nesting IIf for more than two choices
IIf only chooses between two things. When you need three or more outcomes, you nest one IIf inside another - the "otherwise" slot of the first becomes a fresh question:
rsi = RSI(14);

// three zones: overbought, oversold, or neutral
zoneColor = IIf(rsi > 70, colorRed,
            IIf(rsi < 30, colorGreen,
                          colorYellow));   // the final catch-all

Plot(rsi, "RSI", zoneColor, styleThick);
Read it top to bottom like a flowchart: "if RSI is over 70 use red; otherwise, if it is under 30 use green; otherwise use yellow." You can nest as deep as you need, but more than three or four levels gets hard to read - at that point a few separate conditions are usually clearer.
Line up your nested IIf calls so each condition sits under the one above, as in the example. That indentation turns a tangle of brackets into something you can read like a list of rules - and it makes a missing bracket easy to spot.
See IIf decide, bar by bar
The fastest way to feel what IIf does is to watch it choose across a handful of bars. Take a simple rule - Close > 100 - and an IIf that returns +1 when it is true and -1 when it is false. Read each column top to bottom: IIf looks at the condition on that bar and copies across the matching value.
| Bar | 1 | 2 | 3 | 4 | 5 | 6 |
|---|---|---|---|---|---|---|
Close |
98 | 101 | 99 | 104 | 103 | 107 |
Close > 100 |
F | T | F | T | T | T |
IIf(Close>100, +1, -1) |
-1 | +1 | -1 | +1 | +1 | +1 |
That bottom row is the array IIf hands back - a value chosen independently on every bar. Nesting just asks more questions. Here three RSI zones come from one nested IIf, where each "otherwise" passes the leftover bars down to the next test:
| Bar | 1 | 2 | 3 | 4 | 5 | 6 |
|---|---|---|---|---|---|---|
RSI(14) |
25 | 45 | 72 | 81 | 55 | 28 |
RSI > 70? |
F | F | T | T | F | F |
RSI < 30? |
T | F | – | – | F | T |
zone |
OS | -- | OB | OB | -- | OS |
Bar 1 fails the first test (RSI > 70) and passes the second (RSI < 30), so it lands on OS (oversold). Bars 3 and 4 satisfy the first test and never reach the second - they are OB (overbought). Everything left over falls through to the neutral catch-all. That top-to-bottom flow is exactly how the engine reads your nested IIf.
Two mistakes everyone makes once
Two errors trip up almost every beginner. Learn to recognise them now and you will save yourself hours of confusion.
= versus ==. A single equals sign assigns a value; a double equals sign compares. These are completely different:
trend = 1;          // assignment: store 1 in trend
isUp  = trend == 1; // comparison: is trend equal to 1? (true/false)
If you write IIf(trend = 1, ...) you have accidentally set trend to 1 instead of testing it. AmiBroker will usually warn you, but the habit to build is: comparing always uses ==.
Precedence. AFL does the comparisons before it does AND/OR, but mixing them without brackets still bites. When in doubt, wrap each condition in its own parentheses:
// clear and unambiguous - bracket each piece
longOK = (Close > Open) AND (Volume > MA(Volume, 20));
A condition compares like with like. Comparing a price array against a tiny number - say Close > 50 on a stock trading at 2,400 - is true on every bar and quietly useless. Always sanity-check that both sides of a comparison live on the same scale before you trust the result.
Try it yourself
- Colour candles green/red by whether
Closeis above its 20-period EMA, then change the period and watch the colouring shift. - Build a three-state RSI colour using nested
IIf(overbought / oversold / neutral) and plot it. - Count how many of the last 10 bars closed higher than they opened, using
Sum(Close > Open, 10). - Combine three conditions of your choice with
ANDinto a singlelongOKflag and plot it as a histogram to see when it fires.
Recap
- Comparison operators (
>,<,>=,==) produce a true/false array - one answer per bar. - In AFL, true is 1 and false is 0, so conditions can be summed, multiplied and averaged like numbers.
AND,ORandNOTcombine conditions array-by-array; bracket each piece to keep precedence clear.IIf(condition, a, b)picks a value per bar - the engine of colour-coding, dynamic stops and more.- Nest
IIffor three or more outcomes; read it top-to-bottom like a flowchart. - Watch the two classic traps:
=assigns while==compares, and unbracketedAND/ORcan surprise you.
Next we learn to look backwards in time - reaching into yesterday's bar with Ref, spotting the exact moment two lines cross, and counting the bars since an event.