The Formula Editor & Your First Indicator
Write, apply and save your first AFL - a one-line RSI plot - and learn the editor habits that save hours.
- ·Open the Formula Editor
- ·_SECTION_BEGIN / _SECTION_END
- ·Comments & readability
- ·Plot() your first line
- ·Apply Indicator vs Insert
- ·Saving & organising formulas
In the last chapter we took a tour of the building. Now we walk into the workshop, pick up the tools, and make something. By the end of this chapter you will have written, applied and saved a real indicator - twice - and you will understand every word on the screen. No hand-waving; we read the code one line at a time.
AFL is case-insensitive: Close, close and CLOSE all mean the same array. The Formula Editor colours your code as you type and can fold long sections - small comforts that add up over a long formula.
The good news is that AFL rewards beginners. A useful indicator is often three or four lines long. The skill is not typing a lot - it is knowing what each line is for.
Opening the Formula Editor
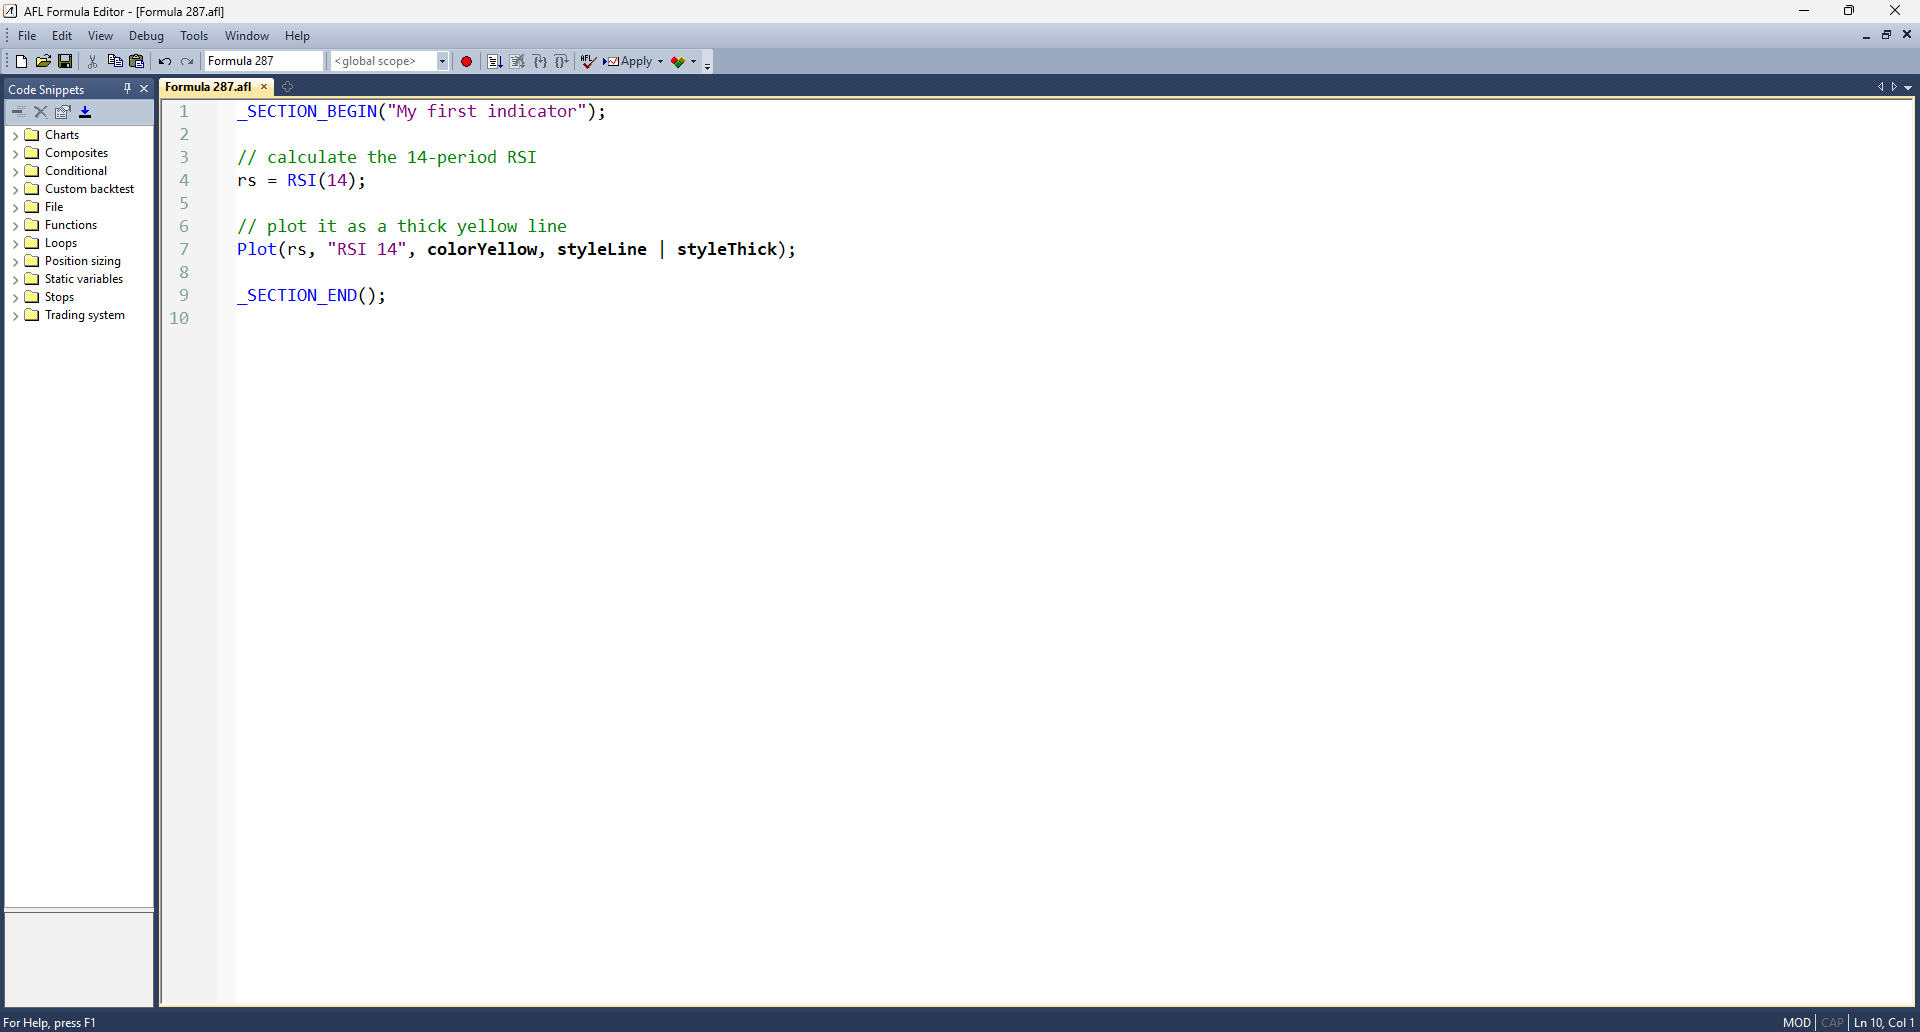
The Formula Editor is the plain code window where every AFL formula is born. Open it from AmiBroker's menu (Analysis -> Formula Editor, or the toolbar button that looks like a small document). A blank, coloured-text window appears. That colouring is syntax highlighting - the editor tints keywords, numbers and text differently so mistakes jump out at you. If Plot is not the colour you expect, you have probably mistyped it.
Type your formula here, then send it to a chart. There are two ways to do that, and beginners mix them up constantly, so let us settle it now.
- Apply Indicator takes the formula you are editing and replaces whatever is in the currently selected chart pane with it. Use this while you are developing - edit, Apply, look, edit again.
- Insert Indicator adds the formula as a new indicator (often in its own new pane) without throwing away what is already there. Use this to stack a finished indicator onto a chart you want to keep.
While you are writing and tweaking code, keep clicking Apply Indicator (or press the Apply button). It gives you a tight loop: change a number, apply, see the chart move. That fast feedback is the single best way to learn AFL.
The wrapper: _SECTION_BEGIN and _SECTION_END
Almost every formula you will read starts and ends like this:
_SECTION_BEGIN("My first indicator");

// ... the real work goes here ...

_SECTION_END();
These two lines are a named wrapper. They do not draw anything. What they do is group everything between them under one label - the text you put in the quotes - in the Parameters window (we meet that window properly in Chapter 6). When your formula later grows sliders and colour pickers, AFL uses these section names to organise them into tidy groups instead of one long list.
For now, treat _SECTION_BEGIN("Some Name") and _SECTION_END() as a polite habit: open a section, write your indicator, close the section. Notice every statement ends with a semicolon ; - that is how AFL knows one instruction has finished.
The leading underscore in _SECTION_BEGIN is just part of its name - AFL uses underscores for a handful of special built-in commands. You type it exactly as shown.
Comments: notes the computer ignores
A comment is a note for humans. AFL skips it entirely. There are two styles:
// this is a single-line comment - everything after // is ignored

/* this is a block comment.
   It can run across several lines,
   handy for longer explanations. */
Comments are not decoration - they are how you remember why you wrote something when you reopen the file six months later. The reference code this course is built on is full of small //calculate RSI notes for exactly this reason. Get into the habit early.
Plot: drawing your first line
The one function that turns numbers into a picture is Plot(). Its basic shape is:
Plot( array, "name", color, style );
Read it as four answers: what to draw (the array of values), what to call it (the "name" shown in the chart title), what colour, and what style (a line, candles, a histogram, and so on). Here is the complete first indicator - a 14-period RSI - grounded in the author's own First Indicator.afl:
_SECTION_BEGIN("My first indicator");

// calculate the 14-period RSI
rs = RSI(14);

// plot it as a thick yellow line
Plot(rs, "RSI 14", colorYellow, styleLine | styleThick);

_SECTION_END();
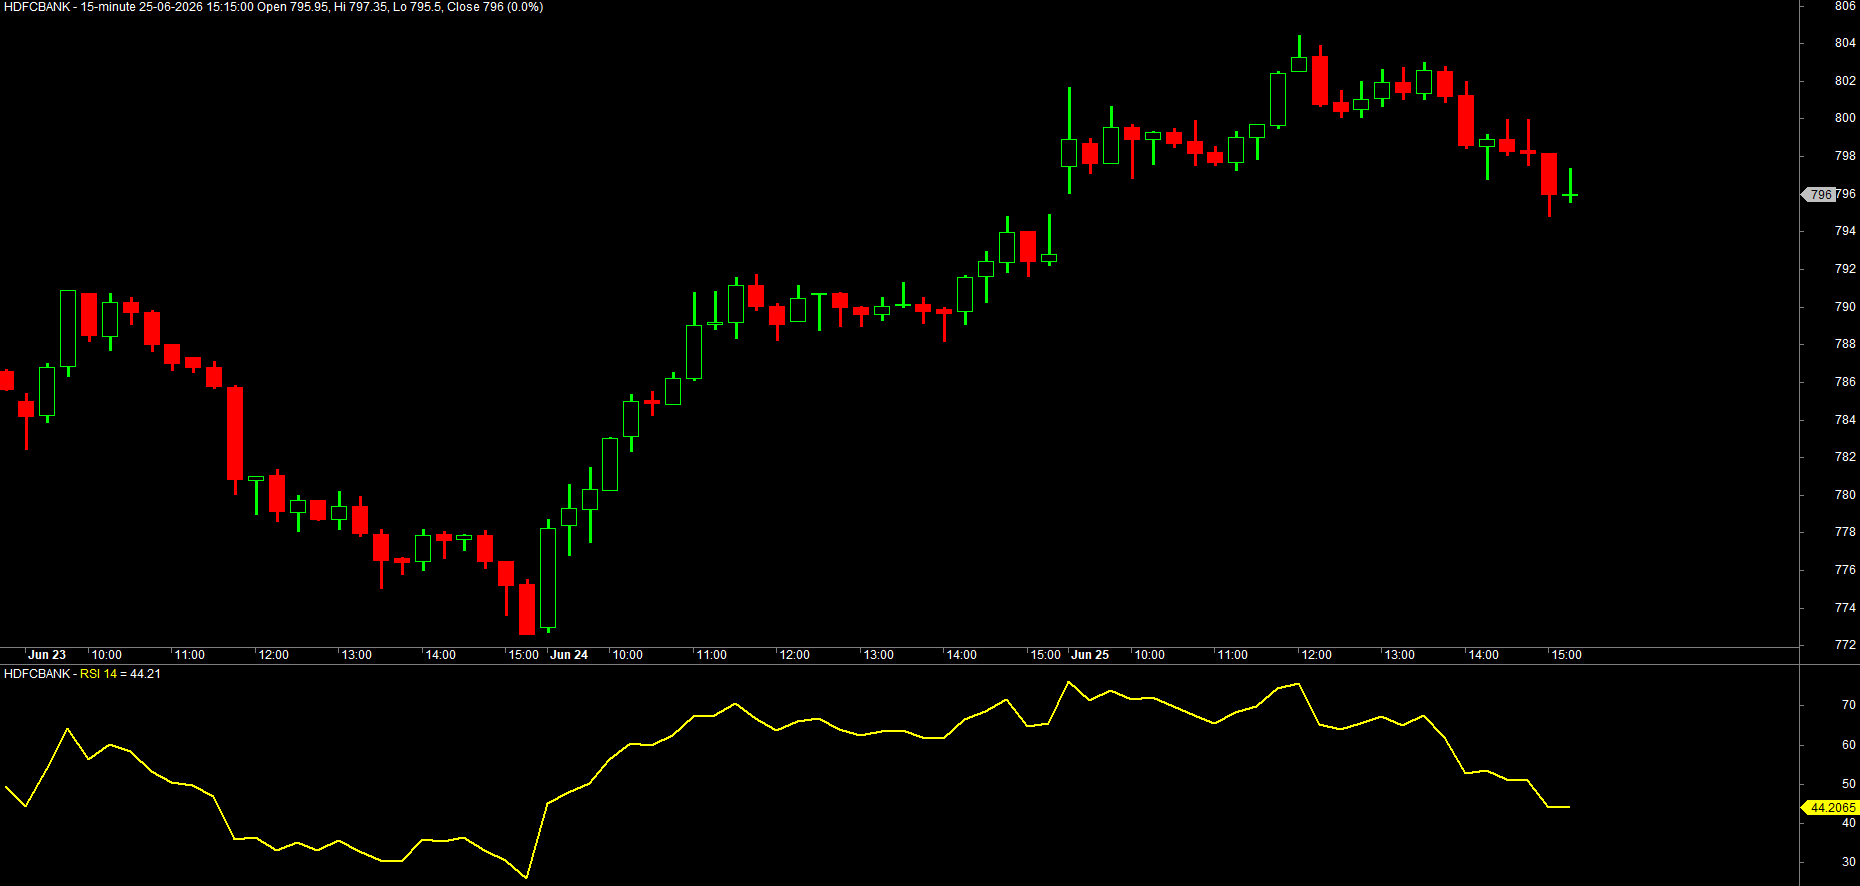
Three working lines. RSI(14) calculates the Relative Strength Index over 14 bars and hands back a whole set of values; we store them in a variable we named rs. Then Plot draws rs as a thick yellow line labelled "RSI 14". The styleLine | styleThick part combines two style options with the | symbol - think of it as "line and thick". We unpack styles fully in Chapter 5.
Apply this to any chart - say NSE RELIANCE or the NIFTY index - and a yellow RSI line appears in its own pane below the price.
Your second indicator: a 20-bar moving average
RSI lives in its own pane. A moving average is different - it belongs on top of the price, because it is measured in rupees just like the price. Here is a 20-bar simple moving average of the close:
_SECTION_BEGIN("Simple Moving Average");

// average closing price over the last 20 bars
avg = MA(Close, 20);

// draw it as a thick line, on the price chart
Plot(avg, "MA 20", colorRed, styleLine | styleThick);

_SECTION_END();
MA(Close, 20) averages the last 20 closing prices at every bar. Because the result is in the same units as price, when you Insert this onto a candlestick chart it overlays neatly across the candles - the familiar smooth line traders watch for crossovers.
Indicators that share the price's units (moving averages, Bollinger Bands, VWAP) overlay on the price pane. Indicators on a different scale (RSI 0-100, MACD around zero, volume) get their own pane. You choose by where you draw - and we will make this deliberate in later chapters.
Saving and organising your .afl files
A formula you cannot find again is a formula you will rewrite. AmiBroker stores code as plain .afl files. From the Formula Editor, use File -> Save As and create a dedicated folder for this course - something like Formulas\AFL Course\. Save this chapter's work as ch02-rsi.afl and ch02-ma20.afl.
Name files for what they do, not "test3.afl". A folder of clearly named formulas becomes your personal library - the EMA crossover, the breakout scanner, the dashboard - that you reuse for years instead of retyping. Future-you will be grateful.
Try it yourself
- Change
RSI(14)toRSI(7), Apply, and watch the line get jumpier. Now tryRSI(21). - In the moving-average formula, change
20to50and the colour fromcolorRedtocolorBlue, then Insert it so both a 20 and a 50 average sit on the same chart. - Add a comment above each
Plotexplaining in your own words what it draws, then re-read your file - does it still make sense? - Save both formulas into your course folder and reopen them from File -> Open to confirm they are really stored.
Recap
- The Formula Editor is where AFL is written; Apply Indicator replaces the current pane (use it while developing), Insert Indicator adds without erasing.
_SECTION_BEGIN("...")/_SECTION_END()are a named wrapper that groups a formula's settings - they draw nothing themselves.- Comments (
//and/* */) are notes AFL ignores but humans need; every statement ends in a semicolon. Plot(array, "name", color, style)turns calculated values into a line on the chart.- We built two indicators: an RSI in its own pane and a 20-bar MA overlaid on price - the difference is scale.
- Save formulas with clear names in a course folder to build a reusable personal library.
Next, we answer the question that makes all of AFL finally click: what is that rs variable, really? The answer - arrays - is the most important idea in the whole course.