Building a Signal Scanner
Scan dozens of symbols for a real setup - MACD crosses, RSI extremes and breakouts - and list only the hits.
- ·Filtering to signals only
- ·MACD / RSI scanners
- ·Breakout & 52-week scans
- ·Showing the trigger value
- ·Scan vs Explore
- ·Saving an analysis project
An exploration that shows every symbol is a spreadsheet. An exploration that shows only the symbols meeting a setup is a scanner - and that is where the Analysis window starts to feel like a superpower. Instead of flipping through 50 charts hunting for a MACD cross, you press one button and get a short list of exactly the names that crossed today.
The Scan is AmiBroker's classic alert engine. Point it at real-time data and it can fire an alert the instant a Buy or Sell becomes true on any symbol in your list.
The trick is the same Filter line from the last chapter, with one change: instead of Filter = 1, we set Filter to the signal condition itself. In this chapter we build three real scanners - a MACD cross, an RSI extreme and a breakout to new highs - and learn to show the value that triggered each hit.
Filter = the signal condition
The whole idea fits in one sentence: set Filter to your buy/sell condition, and only the bars where it fires appear. Everything else is just choosing good conditions and useful columns.
// A bullish MACD cross is our signal
buy = Cross( MACD(), Signal() );

Filter = buy;          // only show bars where the cross happened

AddColumn( Close,    "Close",  1.2 );
AddColumn( MACD(),   "MACD",   1.2 );
AddColumn( Signal(), "Signal", 1.2 );
Apply that to a watchlist with the range set to the last bar, press Explore, and the table lists only the stocks where MACD crossed above its signal line on that bar. The rest are silently dropped. That is a scanner.
A scanner is just an exploration whose Filter is the signal. Filter = buy lists only the hits. Change the condition, change the scan - the machinery never changes.
A MACD cross scanner
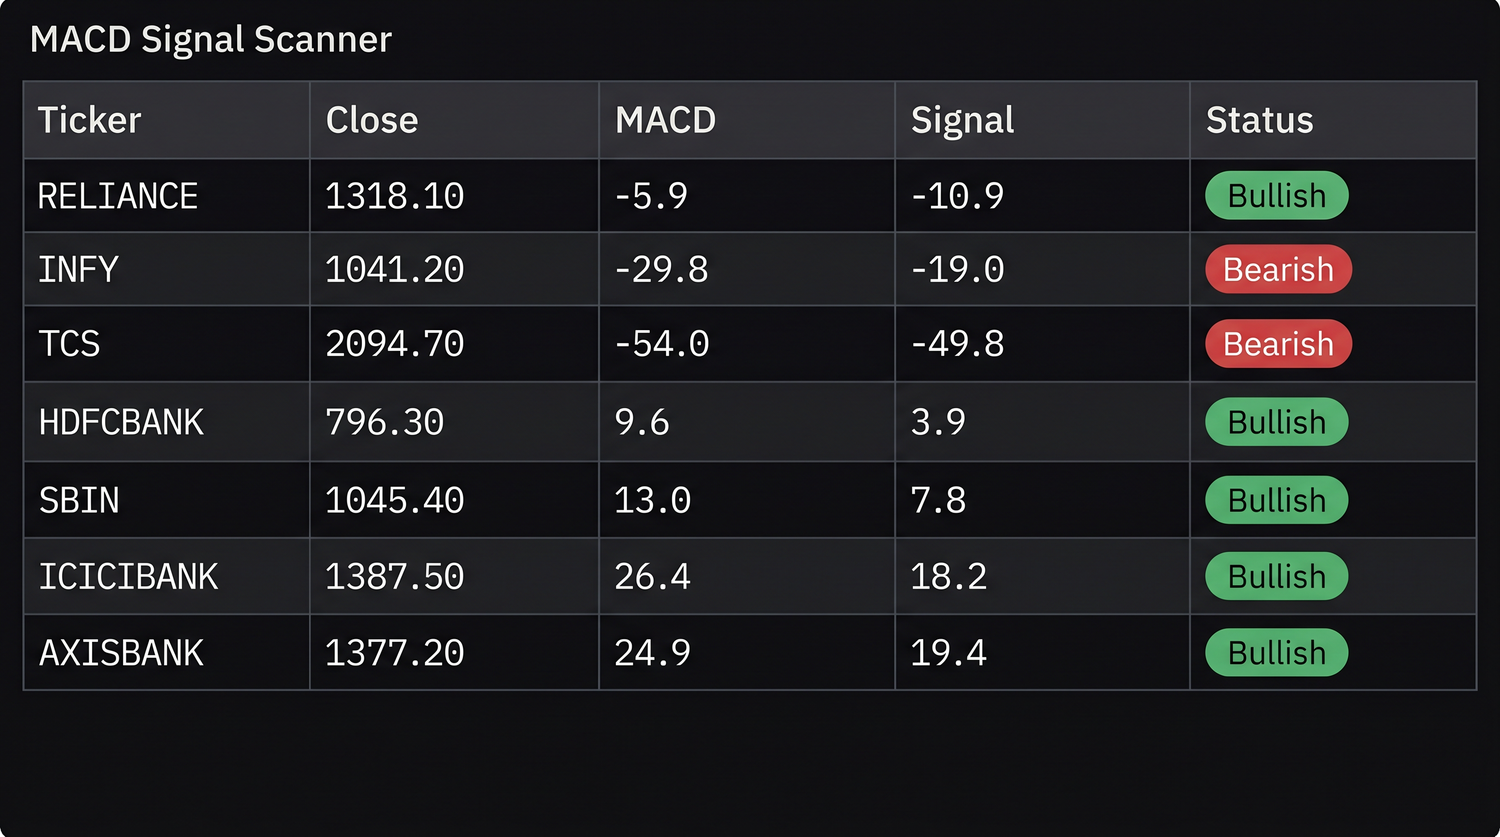
Let us build the MACD scanner properly, showing both the bullish and bearish side and labelling which is which.
_SECTION_BEGIN( "MACD Cross Scanner" );

macdLine   = MACD( 12, 26 );
signalLine = Signal( 12, 26, 9 );

buy  = Cross( macdLine, signalLine );  // bullish cross
sell = Cross( signalLine, macdLine );  // bearish cross

// Show a row whenever EITHER cross happens
Filter = buy OR sell;

// A text label telling us which kind of cross
signalText = WriteIf( buy, "Bullish", "Bearish" );

AddColumn( Close,      "Close",     1.2 );
AddColumn( macdLine,   "MACD",      1.2 );
AddColumn( signalLine, "Signal",    1.2 );
AddTextColumn( signalText, "Cross" );

_SECTION_END();
Filter = buy OR sell is the key line - it lets a row through when either condition is true. The WriteIf column then tells you, per row, whether it was the bullish or bearish cross. One scan, both directions.
An RSI-extreme scanner
Momentum extremes are just as easy. Here we list stocks that have pushed into overbought or oversold territory, and we show the actual RSI value so we can judge how stretched each one is.
_SECTION_BEGIN( "RSI Extremes Scanner" );

r = RSI( 14 );

overbought = r > 70;
oversold   = r < 30;

Filter = overbought OR oversold;

zone = WriteIf( overbought, "Overbought", "Oversold" );

AddColumn( Close, "Close", 1.2 );
AddColumn( r,     "RSI",   1.2 );   // the trigger value, shown in its own column
AddTextColumn( zone, "Zone" );

_SECTION_END();
Showing the trigger value - here the RSI itself - is a habit worth forming. A scanner that only says "this stock is oversold" makes you go and check; a scanner that says "oversold, RSI 22.4" lets you rank and act straight from the table.
Always add a column for the number that fired the signal. For a cross, show both lines; for an RSI scan, show the RSI; for a breakout, show the level that was broken. The trigger value turns a yes/no list into something you can sort and prioritise.
A breakout / 52-week-high scanner
Breakouts combine a price condition with a volume condition - a cleaner setup than price alone. Here is a new-high breakout confirmed by heavy volume.
_SECTION_BEGIN( "Volume Breakout Scanner" );

newHigh  = High > Ref( High, -1 );              // higher high than the prior bar
volBreak = Volume > Ref( HHV( Volume, 30 ), -1 ); // volume tops its own 30-bar high

breakout = newHigh AND volBreak;

Filter = breakout;

AddColumn( High,                    "High",          1.2 );
AddColumn( Close,                   "Close",         1.2 );
AddColumn( Volume,                  "Volume",        1.0 );
AddColumn( Ref( HHV( Volume, 30 ), -1 ), "30-bar Max Vol", 1.0 );

_SECTION_END();
The Ref( ..., -1 ) on the volume high is deliberate - it compares today's volume against the highest of the previous 30 bars, so a stock clears a real prior barrier rather than its own current spike. For a true 52-week high scan, swap the window to roughly a year of bars:
lookback   = 252;                              // ~52 weeks of daily bars
prevHigh   = Ref( HHV( High, lookback ), -1 ); // last year's high, excluding today
is52wHigh  = High > prevHigh;

Filter = is52wHigh;
AddColumn( Close,    "Close",        1.2 );
AddColumn( prevHigh, "Prev 52W High", 1.2 );
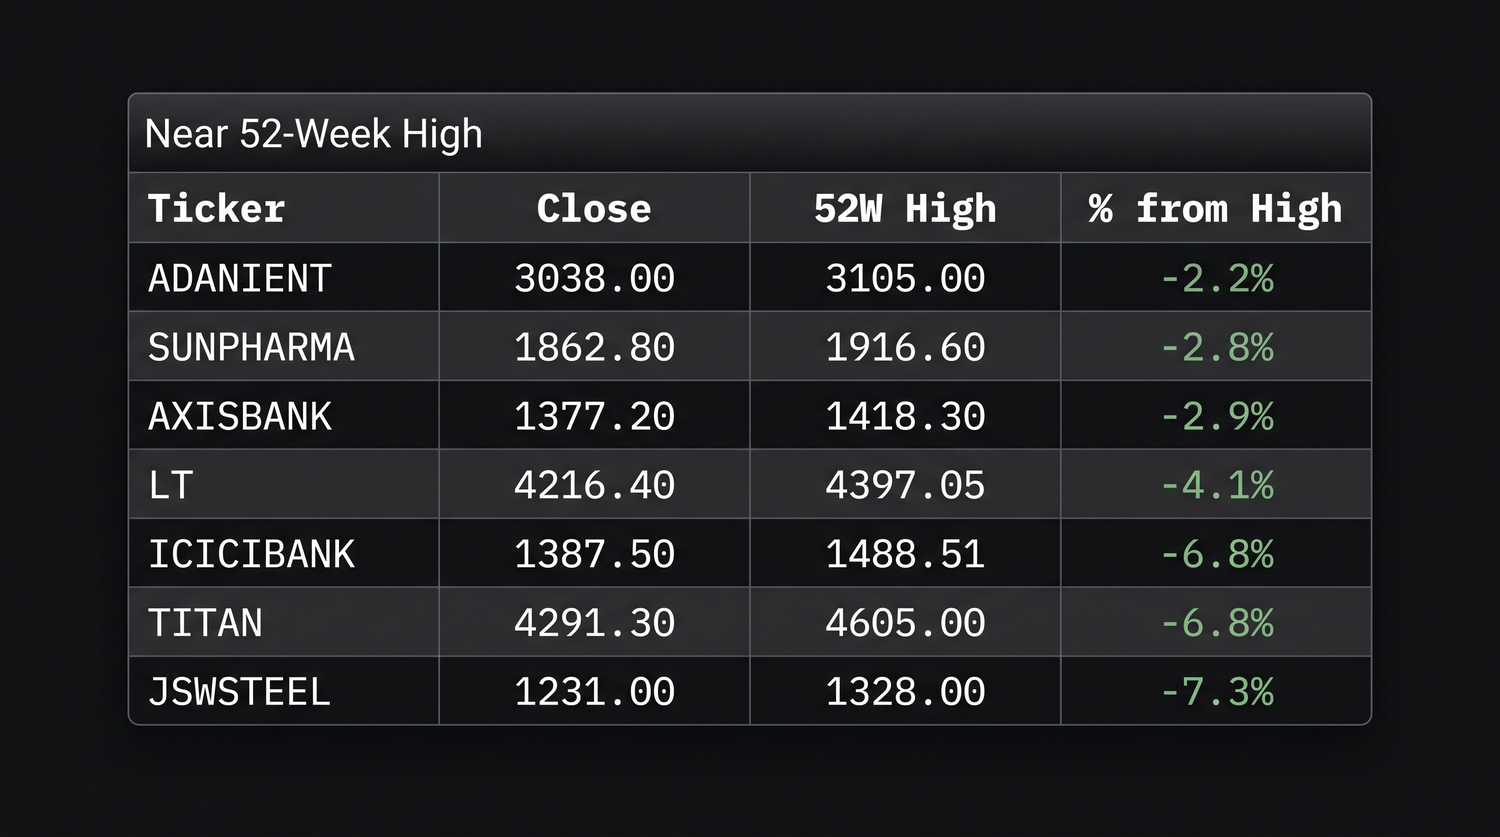
This is the bread-and-butter momentum screen: every name printing a fresh yearly high, in one short list.
Scan vs Explore
You will notice two similar buttons: Explore and Scan. They overlap, with one practical difference:
- Explore builds a results table you read and sort - the right choice for screening and ranking. Everything in this chapter is an Explore.
- Scan is purpose-built for
Buy/Sell/Short/Coversignals across history and can fire alerts the moment a signal appears. It does not build the rich column table; it reports signals.
For finding setups right now and studying them, use Explore. When you reach alerts in Module H and want AmiBroker to notify you the instant a signal triggers, Scan is the tool. Same formulas; different purpose.
A scanner formula and a system formula share the same conditions. The exploration's Filter = buy OR sell uses the very same buy and sell you will hand to the backtester later. Build the condition once, reuse it everywhere.
Saving an analysis project
Once a scanner is dialled in - the right watchlist, range and formula - save the whole setup as an Analysis Project (an .apx file) from the Analysis window. Reopening it restores the formula, the watchlist and the range together, so your "morning breakout scan" is one double-click away instead of a re-assembly job every day.
Try it yourself
- Run the MACD scanner on a 50-stock watchlist with the range set to the last bar and read off today's crosses.
- Modify the RSI scanner to use 80/20 instead of 70/30 and see how the list shrinks.
- Add a
MA( Volume, 20 )column to the breakout scan so you can judge how unusual each volume spike is. - Save your favourite scan as an
.apxproject and reopen it to confirm it restores everything.
Recap
- A scanner is an exploration with
Filterset to the signal condition - only hits appear. Filter = buy OR selllets either direction through; aWriteIfcolumn labels which.- Always show the trigger value (the cross lines, the RSI, the broken level) so you can rank.
- Breakouts pair a price condition with volume; a 52-week high uses a ~252-bar
HHV. - Explore builds the table; Scan fires alerts. Save the whole setup as an
.apxproject.
Next we polish these tables - multiple conditions, sorted columns, coloured cells and ranking your universe by strength.