GFX Dashboards
Draw your own panels - boxes, gradients and text - with the low-level GFX functions for a polished dashboard.
- ·GfxText & GfxSelectFont
- ·GfxRectangle & GfxGradientRect
- ·Coordinates & pixels
- ·A signal status box
- ·A responsive top dashboard
- ·When GFX is worth it
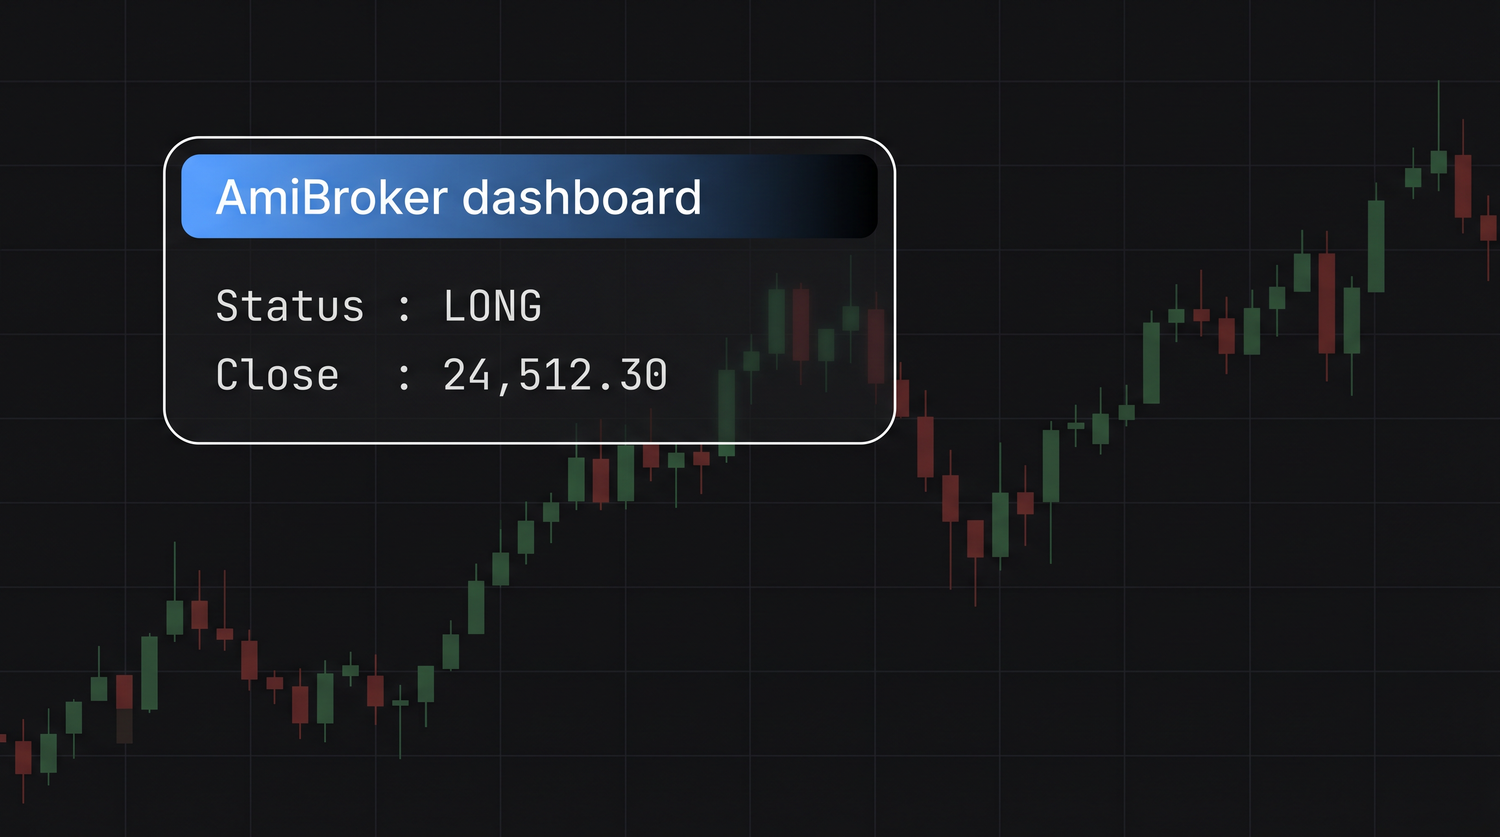
A title bar is one line of text. A coloured candle is a style on a plot. But sometimes you want something the standard tools cannot give you: a proper panel - a rounded box with a heading, a status light that turns green or red, your buy price, stop and target laid out like an instrument cluster on a dashboard. For that, AmiBroker hands you a box of drawing tools called the GFX functions, and they let you paint anything you like, pixel by pixel, straight onto the chart.
The Gfx... drawing functions ride on AmiBroker's QuickGFX engine, which renders charts up to forty times faster than the old one - the same speed headroom that lets a busy dashboard repaint smoothly.
GFX is a small step up in effort, so we keep it approachable. By the end of this chapter you will have built a signal-status box that sticks to a corner of the chart and updates with your strategy.
How GFX thinks: pixels, not prices
Ordinary plots live in the world of prices and bars - a point is "24,000 on Tuesday". GFX lives in the world of pixels - a point is "120 pixels from the left, 80 pixels from the top". The origin (0, 0) is the top-left corner of the chart, x grows to the right, and - this trips everyone up at first - y grows downward. So (10, 10) is near the top-left, and a larger y is further down the screen.
Because of that, every GFX drawing is independent of the candles. It does not scroll or zoom with price; it stays put on the glass. That is exactly what you want for a dashboard.
GFX calls are immediate drawing instructions, not arrays. They run once per repaint and paint on top of the chart. You do not assign their result to a variable - you simply issue the commands in order, like telling a pen where to go.
The smallest GFX example: font, colour, text
Four calls get text onto the chart. Pick a font, set the background mode, choose a colour, then write:
GfxSelectFont( "Tahoma", 13, 100 );  // face, size, weight (100 = normal, 700 = bold)
GfxSetBkMode( 1 );                   // 1 = transparent: no box behind the text
GfxSetTextColor( colorWhite );

GfxTextOut( "AmiBroker dashboard", 30, 30 );  // text, x, y (in pixels)
GfxTextOut( text, x, y ) writes at a pixel position. Its cousin GfxText is similar; GfxTextOut is the one you will reach for most. Setting GfxSetBkMode(1) to transparent is important - otherwise each line of text drags an opaque rectangle behind it.
Boxes: rectangles, rounded corners and gradients
A panel needs a background to sit on. You set a pen (the border) and a brush (the fill), then draw a shape:
GfxSelectPen( colorGreen, 2 );        // border colour and thickness
GfxSelectSolidBrush( colorDarkGrey ); // fill colour

GfxRectangle( 20, 20, 320, 120 );          // x1, y1 (top-left)  x2, y2 (bottom-right)
GfxRoundRect( 20, 140, 320, 240, 12, 12 ); // same, plus corner roundness
GfxRectangle takes the two opposite corners. GfxRoundRect adds two numbers for how rounded the corners are - a softer, modern look. For a richer panel, GfxGradientRect fills a box with a colour that fades from one shade to another:
GfxGradientRect( 20, 20, 320, 60, colorBlue, colorBlack ); // fades blue -> black
Draw the box first, then the text on top, because GFX paints in the order you call it - later calls cover earlier ones.
A signal-status box
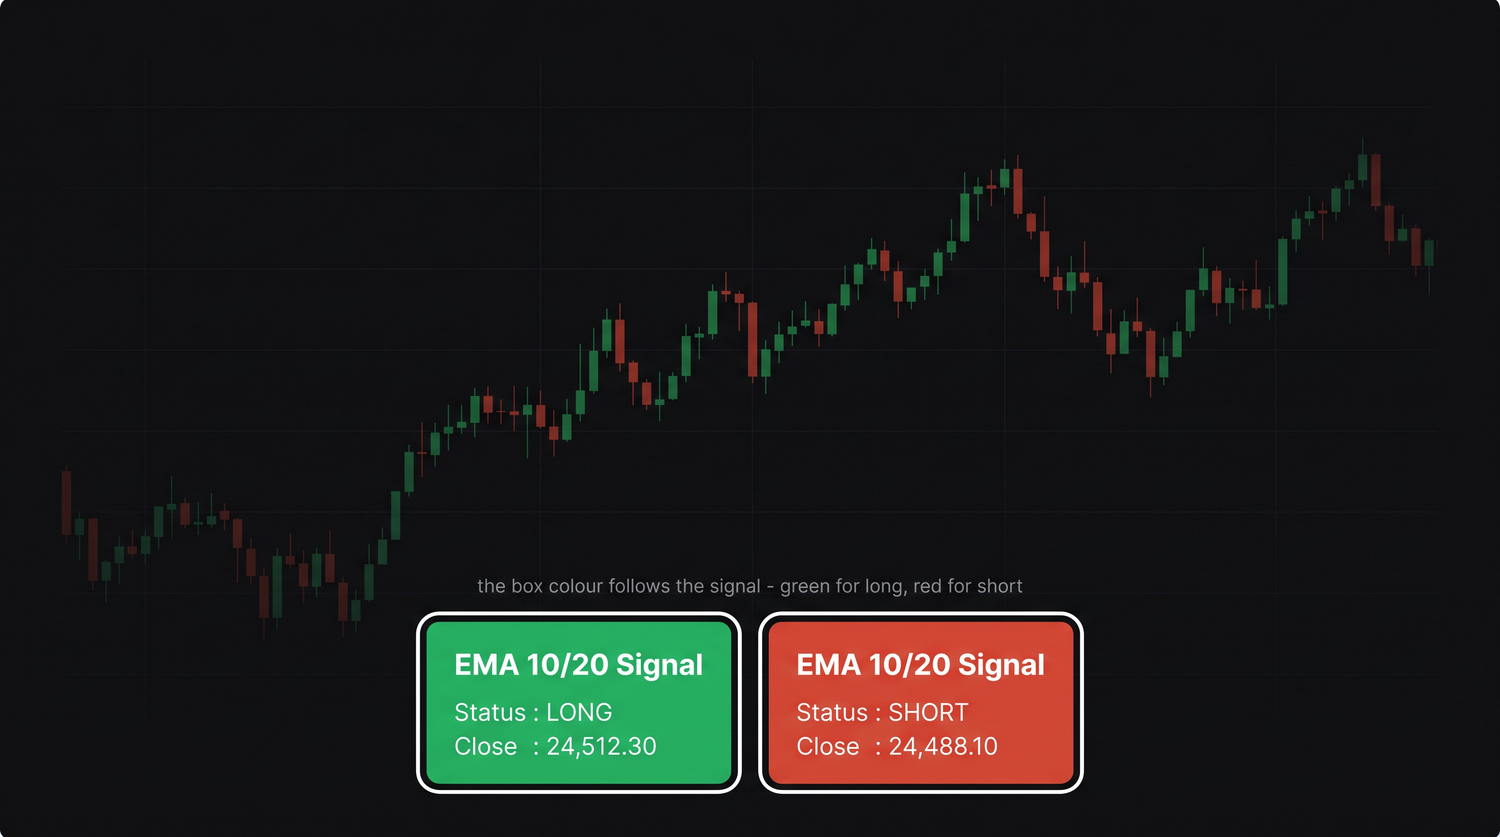
Now we combine the pieces into something useful: a box whose colour reflects whether a simple strategy is long or short, with the key numbers printed inside. We will drive it from an EMA crossover.
// --- the signal we want to display ---
fast = EMA( Close, 10 );
slow = EMA( Close, 20 );
isLong = Flip( Cross( fast, slow ), Cross( slow, fast ) ); // true while in a long

// --- pick a colour from the signal (read at the last bar) ---
boxColor = IIf( SelectedValue( isLong ), colorGreen, colorRed );

// --- draw the panel ---
GfxSetBkMode( 1 );
GfxSelectFont( "Tahoma", 13, 700 );
GfxSelectPen( colorWhite, 1 );
GfxSelectSolidBrush( SelectedValue( boxColor ) );   // a brush needs ONE colour, not an array
GfxRoundRect( 20, 20, 300, 120, 10, 10 );

GfxSetTextColor( colorWhite );
status = WriteIf( SelectedValue( isLong ), "LONG", "SHORT" );
GfxTextOut( "EMA 10/20 Signal", 35, 30 );
GfxTextOut( "Status : " + status, 35, 55 );
GfxTextOut( "Close  : " + NumToStr( SelectedValue( Close ), 1.2 ), 35, 80 );
Notice SelectedValue again. GFX draws a single picture, so anything you feed a brush or a text line must be a single number or string, not a whole array. SelectedValue collapses an array down to the value at the selected bar - exactly what a one-shot drawing needs.
Plots take arrays; GFX takes single values. Wrap arrays in SelectedValue() (or LastValue()) before handing them to GfxSelectSolidBrush, GfxTextOut or any GFX call. This is the single most common GFX mistake.
Making it responsive
Hard-coding (20, 20) pins the box to the top-left, which is fine - until you resize the window and it floats in empty space, or worse, off-screen. The fix is to ask the chart how big it currently is and position relative to that. Status("pxchartwidth") and Status("pxchartheight") return the current chart size in pixels.
w = Status( "pxchartwidth" );
h = Status( "pxchartheight" );

// anchor a box to the BOTTOM-LEFT, 100 px tall, 280 px wide
x1 = 20;        y1 = h - 120;
x2 = 20 + 280;  y2 = h - 20;

GfxSelectSolidBrush( colorDarkGrey );
GfxRoundRect( x1, y1, x2, y2, 10, 10 );
By subtracting from h, the box stays glued to the bottom no matter how tall the pane gets. The same trick with w keeps a panel pinned to the right edge. This is how the author's dashboards stay tidy across laptop and monitor sizes.
When GFX is worth the effort
GFX is more verbose than a Plot - you manage coordinates and order yourself. So use it where it earns its keep:
- A status panel that summarises a system at a glance - signal, entry, stop, target, open P&L.
- A small table of values (build a
TableCellhelper once and reuse it everywhere). - A heads-up label that must stay fixed on screen rather than scroll with price.
For an indicator line, a band, or arrows, the ordinary Plot and PlotShapes are simpler and better - reach for GFX only when you genuinely need a fixed, designed panel.
Wrap your whole dashboard in a ParamToggle( "Dashboard", "Show|Hide", 1 ) and an if block. Then you can hide the panel with one click when you want a clean chart - and it costs nothing when hidden.
Try it yourself
- Build the EMA signal box, then resize the chart window and confirm the responsive version stays put.
- Add a fourth line showing open profit:
NumToStr( SelectedValue( Close - ValueWhen( Buy, Close ) ), 1.2 ). - Swap
GfxRoundRectforGfxGradientRectto give the heading bar a colour fade. - Add the
ParamToggleshow/hide switch and a colour picker for the box.
Recap
- GFX draws in pixels from the top-left, with y growing downward - independent of price and bars.
- Text needs
GfxSelectFont,GfxSetBkMode(1),GfxSetTextColorthenGfxTextOut. - Shapes need a pen and a brush, then
GfxRectangle,GfxRoundRectorGfxGradientRect; draw boxes before text. - GFX takes single values - wrap arrays in
SelectedValue(). - Use
Status("pxchartwidth")/"pxchartheight"to anchor panels responsively, and reserve GFX for dashboards that earn the extra effort.
That wraps up charting. Next we change rooms entirely - from one chart to the Analysis window, where a single formula screens your whole watchlist at once.