How AFL Thinks: Arrays & Bars
The single most important idea in AFL - every variable is a whole array of values, one per bar. Get this and everything else is easy.
- ·What an array really is
- ·One value per bar
- ·Vectorised vs bar-by-bar thinking
- ·The current bar vs the array
- ·Why there are almost no loops
- ·Visualising arrays as columns
If only one chapter of this course sticks, let it be this one. There is a single idea that separates people who fight AFL from people who flow with it. It is not hard - in fact it is simpler than how most programming languages work - but it is unfamiliar, so we are going to take our time and look at it from several angles until it clicks.
The idea is this: in AFL, a variable is not a single number. It is a whole column of numbers - one value for every bar on the chart. That column is called an array (programmers also call it a vector). Once you truly see variables as columns - one cell per bar, stacked in time - the strange parts of AFL stop being strange.
A chart is a spreadsheet turned sideways
Picture your favourite stock - say NSE INFY - as a spreadsheet. Each row is one bar (one day, or one 5-minute candle). Each column is a piece of information about that bar: the open, the high, the low, the close, the volume.
| Bar | Date | Close |
|---|---|---|
| 0 | Mon | 1500 |
| 1 | Tue | 1512 |
| 2 | Wed | 1495 |
| 3 | Thu | 1530 |
| 4 | Fri | 1548 |
When you write Close in AFL, you are not referring to one day's close. You are referring to the entire Close column - all five numbers at once. Close is an array. So is Open, High, Low, Volume, and so is every variable you create from them.
Say it out loud: Close is not a number, it is the whole column of closes. Every AFL variable is a column with one value per bar. This is the master key to the language.
Doing maths to a whole column at once
Here is where it gets beautiful. When you write:
mid = (High + Low) / 2;
you are not calculating one midpoint. AFL lines up the High column and the Low column, adds them row by row, divides every row by 2, and stores the resulting column in mid. One short line, computed across thousands of bars in an instant.
| Bar | High | Low | (High+Low)/2 -> mid |
|---|---|---|---|
| 0 | 1510 | 1490 | 1500 |
| 1 | 1520 | 1500 | 1510 |
| 2 | 1505 | 1480 | 1492.5 |
| 3 | 1540 | 1515 | 1527.5 |
This is called vectorised thinking - "do it to the whole column at once". You describe the calculation once, as if for a single row, and AFL applies it to every row automatically. The mental move is exactly like dragging a formula down an entire spreadsheet column - except you do not even drag; AFL fills the whole column for you.
range  = High - Low;        // a column: each bar's high-low range
typical = (High + Low + Close) / 3;  // a column: each bar's typical price
Both lines produce arrays. range holds every bar's range; typical holds every bar's typical price. You never wrote a loop, never said "for each bar". You did not have to.
Why AFL needs almost no loops
If you have dabbled in ordinary programming - Python, JavaScript, Excel macros - you may expect to write a loop: "go to bar 0, calculate, move to bar 1, calculate, move to bar 2..." That bar-by-bar style works, but in AFL it is usually the slow, clumsy way.
Because AFL treats whole columns as single values, the loop is built into the language. MA(Close, 20) does not make you walk through bars adding and dividing - it hands you a finished column where every row already holds the 20-bar average up to that bar.
fast = EMA(Close, 10);   // whole column of 10-bar EMA values
slow = EMA(Close, 20);   // whole column of 20-bar EMA values
gap  = fast - slow;      // whole column: how far fast is above/below slow
Three lines, three full columns, zero loops. Compare that to a language where you would write a dozen lines and an index variable. This is why AFL feels almost like writing on a chart with a marker: you describe the shape you want, and the engine fills in every bar.
AmiBroker's array engine is the reason it can scan hundreds of symbols in the blink of an eye. Vectorised maths runs in tight, optimised native code under the hood - far faster than a hand-written bar-by-bar loop in a scripting language.
There are a few problems that genuinely need a loop - a trailing stop that depends on its own previous value, for instance - and Chapter 10 shows you how to write one cleanly. But that is the exception. For now, the lesson is: reach for array maths first; loops are a last resort.
"The current bar" and "the selected bar"
If every variable is a whole column, you might wonder: when does AFL ever talk about one bar?
Two situations. First, when AFL draws, it walks the column left to right and plots each value at its bar - so the mid column becomes a line across the chart. Second, AmiBroker shows you a single row of those columns in the chart's Title. By default - when no bar is clicked - the Title shows the values of the latest bar, the current running bar at the right edge. When you click a bar to select it, the Title switches to that selected bar - the row SelectedValue() returns inside a formula - and stays there until you select another. Either way the array is still the whole column; the Title just shows you one row of it.
So "the current bar" usually means the row AFL is looking at right now - the bar it is drawing, or the bar shown in the Title (the latest bar by default, or the one you clicked to select). The variable itself never stops being the full column.
Reading the columns together
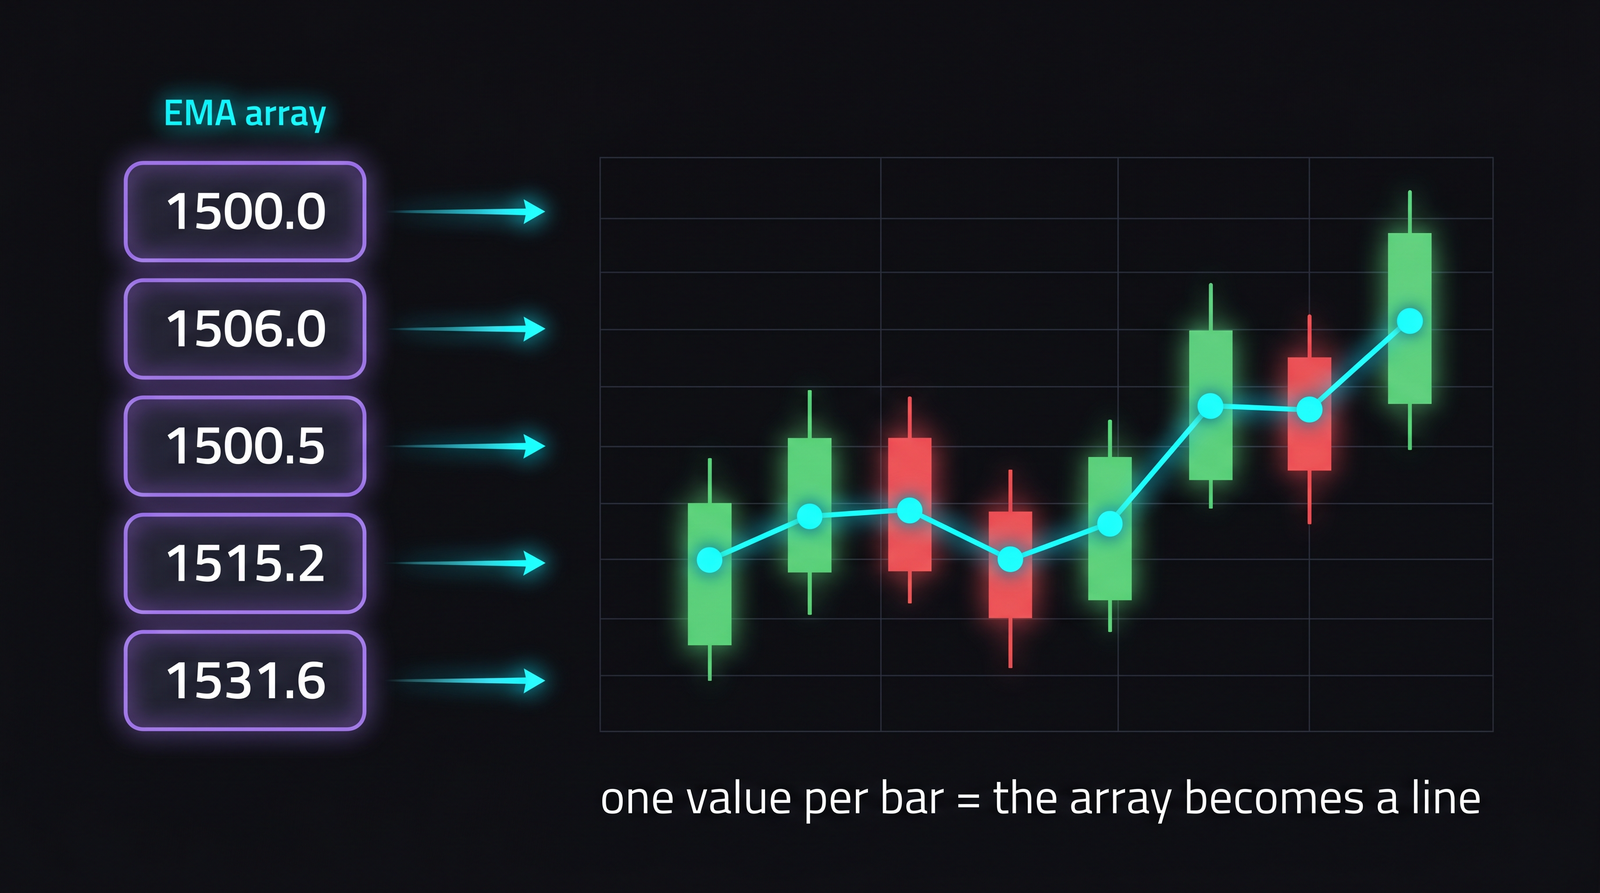
Let us put a price array and an indicator array side by side, the way AFL holds them in memory. This is the picture to keep in your head:
| Bar | Close | EMA(Close,3) |
|---|---|---|
| 0 | 1500 | 1500.0 |
| 1 | 1512 | 1506.0 |
| 2 | 1495 | 1500.5 |
| 3 | 1530 | 1515.2 |
| 4 | 1548 | 1531.6 |
Close and EMA(Close,3) are two columns of equal length, perfectly aligned bar for bar. When you write Close > EMA(Close,3), AFL compares them row by row and produces a third column - one made of 1s (true) and 0s (false) - telling you on which bars price closed above its average. That true/false column is itself an array, and it is the seed of every trading signal you will ever build. We grow it into real Buy and Sell rules in Module E.
Whenever an AFL line confuses you, mentally redraw this table. Ask: "what does each column look like, and what column does this line produce?" Almost every AFL bug dissolves the moment you picture the columns instead of imagining single numbers.
Columns come in many flavours
So far our columns held prices. But an AFL array can hold any kind of value - and the quiet magic is that, underneath, they are nearly all just numbers stacked in a column. Here are the same five bars seen through six different columns at once, the way AmiBroker's own interpretation window stacks them:
| Bar | 1 | 2 | 3 | 4 | 5 |
|---|---|---|---|---|---|
Close |
100.5 | 101.2 | 99.8 | 103.0 | 102.4 |
Volume |
1200 | 1500 | 900 | 2200 | 1700 |
Close > Open |
T | F | T | T | F |
colour: IIf(up, ...) |
green | red | green | green | red |
shape: IIf(Buy, ...) |
up | none | none | up | none |
text: WriteIf(up, ...) |
BUY | -- | BUY | BUY | -- |
Read down any one bar and you see six different facts about that single moment. Read across any one row and you watch one quantity evolve through time. Both views matter - and every row is an array of the same length, locked bar-for-bar.
Numbers: decimals and whole numbers
Close, High, EMA(Close, 20) hold decimal numbers. Volume and OpenInt happen to be whole numbers, but AFL stores them the same way (as floating point), so you can mix and divide them freely - Close * Volume is a perfectly good column.
True / false: secretly 1 and 0
A comparison like Close > Open produces a column of true/false values - but AFL stores true as 1 and false as 0. So a true/false array is really a column of 1s and 0s wearing a yes/no costume, which is exactly why (in the next chapters) you can add and average signals like ordinary numbers.
Colours and shapes: numbers in disguise
Here is the part that surprises beginners. colorGreen, colorRed, shapeUpArrow, shapeNone are not special "colour things" or "shape things" - they are simply named numbers. The colour names are indices into AmiBroker's palette, and shapeUpArrow is just the number 1 while shapeNone is 0. So IIf(up, colorGreen, colorRed) builds an ordinary numeric column, and Plot or PlotShapes merely interprets those numbers as colours or arrows when it draws. Once you see that, "an array of colours" is no stranger than an array of prices.
Almost every array in AFL is, at heart, a column of numbers. True/false, colours and shapes are just numbers with friendly names. That uniformity is the whole reason one small set of tools - IIf, Ref, Sum, ValueWhen - works on all of them equally.
Text: the one that is different
Text is the exception. A piece of text like "BUY" is a string, and AFL does not keep a full per-bar column of strings the way it does for numbers. Instead you generate text for display, one bar at a time - WriteIf(up, "BUY", "--") in a Title, or AddTextColumn in an Exploration. So when you want words on the screen - a status label, a signal name - reach for WriteIf and StrFormat rather than expecting a string to behave like a price array. We use them properly in Chapter 14.
Try it yourself
- On paper, write a tiny five-row table of
HighandLow, then fill in themid = (High + Low) / 2column by hand. You just did what AFL does instantly. - Apply
Plot((High + Low) / 2, "Mid", colorAqua);to a chart and confirm the line threads through the middle of each candle. - Click different bars and watch the Title switch to that selected bar's values - with nothing selected it shows the latest (current) bar. The selected bar is the one
SelectedValue()reads. - Add
Plot(Close > MA(Close, 20), "AboveAvg", colorGreen, styleHistogram);and notice the histogram is only ever 0 or 1 - your first true/false array.
Recap
- Every AFL variable is an array - a whole column of values, one per bar - not a single number.
- A chart is a spreadsheet turned sideways:
Open,High,Low,Close,Volumeare columns, and so is anything you compute from them. - Maths and functions act on entire columns at once (vectorised thinking) - like dragging a formula down a spreadsheet, but automatic.
- Because the loop is built in, AFL needs almost no loops; reach for array maths first.
- "The current/selected bar" is just one row of a column - the variable is always the full column.
- Comparing two arrays produces a true/false (1/0) array, the foundation of every signal you will build.
Next, we get concrete about those built-in columns - the price arrays O, H, L, C, V - and start storing our own results in variables with operators.