Price Arrays, Variables & Operators
Meet O, H, L, C, V and Volume, store results in variables, and do maths across an entire chart at once.
- ·Open/High/Low/Close/Volume arrays
- ·Assigning variables
- ·Arithmetic across arrays
- ·Typical price & ranges
- ·Operators & precedence
- ·Reading the chart's data window
You now know the big secret - every variable is a column. This chapter puts that idea to work on the columns AmiBroker hands you for free: the price arrays. We will name them, do arithmetic across them, store the results in our own variables, and read the answers back off the chart. Nothing here is complicated, but it is the bread and butter you will use in every formula for the rest of the course.
The price arrays come with one-letter aliases - O, H, L, C, V are identical to Open, High, Low, Close, Volume. The short forms exist purely to keep busy formulas readable.
The built-in price arrays
The moment a symbol's data loads, AmiBroker fills six columns for you. You never declare them; they are simply there:
Open- the opening price of each barHigh- the highest price of each barLow- the lowest price of each barClose- the closing price of each barVolume- the quantity traded in each barOpenInt- open interest (mainly for F&O contracts like NFO NIFTY futures)
Each is a full array, aligned bar for bar, exactly as we pictured in the last chapter. Because you type them so often, AFL gives every one a single-letter alias:
// these pairs mean exactly the same thing
O   // Open
H   // High
L   // Low
C   // Close
V   // Volume
So Close and C are interchangeable, as are High and H, and so on. The author's reference code uses both freely - longer names when clarity helps, short aliases when a line gets crowded. Pick whichever reads better; just be consistent within a formula.
AFL is not case-sensitive for these names. Close, close and CLOSE all refer to the same array. By convention this course capitalises the first letter (Close, High) so price arrays stand out from your own variables.
Storing your own variables
A variable is just a name you give to a column so you can reuse it. You create one with a single = and a semicolon:
range = High - Low;
Read it right-to-left: "take the High column, subtract the Low column row by row, and store the resulting column under the name range." From now on, range is that column - every bar's high-to-low range - and you can plot it, compare it, or feed it into another calculation.
Here is the author's own Average.afl, almost unchanged - about as simple as a real indicator gets:
_SECTION_BEGIN("Averages");

// average of the four prices, computed for every bar
average = (Open + High + Close + Low) / 4;

// the variable 'average' is an array - one value per bar
Plot(average, "Average", colorYellow);

_SECTION_END();
That one expression runs across every bar at once. average is a brand-new column you invented, sitting alongside the built-in ones.
Choose variable names that say what they hold: range, typical, bodySize, fastEMA. A formula full of a, b, x2 is a formula you will not understand next week. Good names are free documentation.
Arithmetic across whole arrays
Every arithmetic operator works column-wide, row by row:
range    = High - Low;                 // size of each bar
body     = abs(Close - Open);          // candle body size (abs = absolute value)
mid      = (High + Low) / 2;           // midpoint of each bar
typical  = (High + Low + Close) / 3;   // the classic "typical price"
changePct = (Close - Open) / Open * 100; // percent change within the bar
Look at typical - the typical price (H + L + C) / 3 is a genuinely useful building block; VWAP and many bands are built on it, and you will see it again. Notice too that changePct mixes several operators in one line, which brings us to a rule worth knowing.
Operators and precedence
When several operators share a line, AFL follows the same order of operations you learned in school - often shortened to BODMAS:
- Brackets
( )first - Multiplication
*and division/next - Addition
+and subtraction-last
So in (High + Low + Close) / 3, the brackets force the three prices to be added before the division. Without them, High + Low + Close / 3 would divide only Close by 3 first, then add - a completely different (and wrong) answer.
When in doubt, add brackets. They cost nothing, they make your intent obvious to the next reader, and they prevent the most common arithmetic bug in AFL: a division or multiplication quietly binding tighter than you expected.
The arithmetic operators you will use are +, -, *, /, and % (the remainder after division - handy for "every Nth bar" tricks later). They all act on entire arrays.
See the columns line up
The easiest way to trust this is to lay the columns side by side and watch them stay locked together. Every price array and every variable you derive from them is one column, with exactly one value per bar - so they line up bar-for-bar, never drifting out of step. Read down a single bar and you see every fact about that moment at once:
| Bar | 1 | 2 | 3 | 4 | 5 |
|---|---|---|---|---|---|
Open |
100 | 102 | 101 | 104 | 103 |
High |
103 | 104 | 103 | 106 | 105 |
Low |
99 | 101 | 100 | 103 | 102 |
Close |
102 | 101 | 103 | 105 | 104 |
range = High - Low |
4 | 3 | 3 | 3 | 3 |
typical = (H+L+C)/3 |
101.33 | 102.00 | 102.00 | 104.67 | 103.67 |
range and typical are brand-new columns AFL builds for you by doing the maths down every bar at once - no loop, no dragging, just one line each.
A small worked indicator
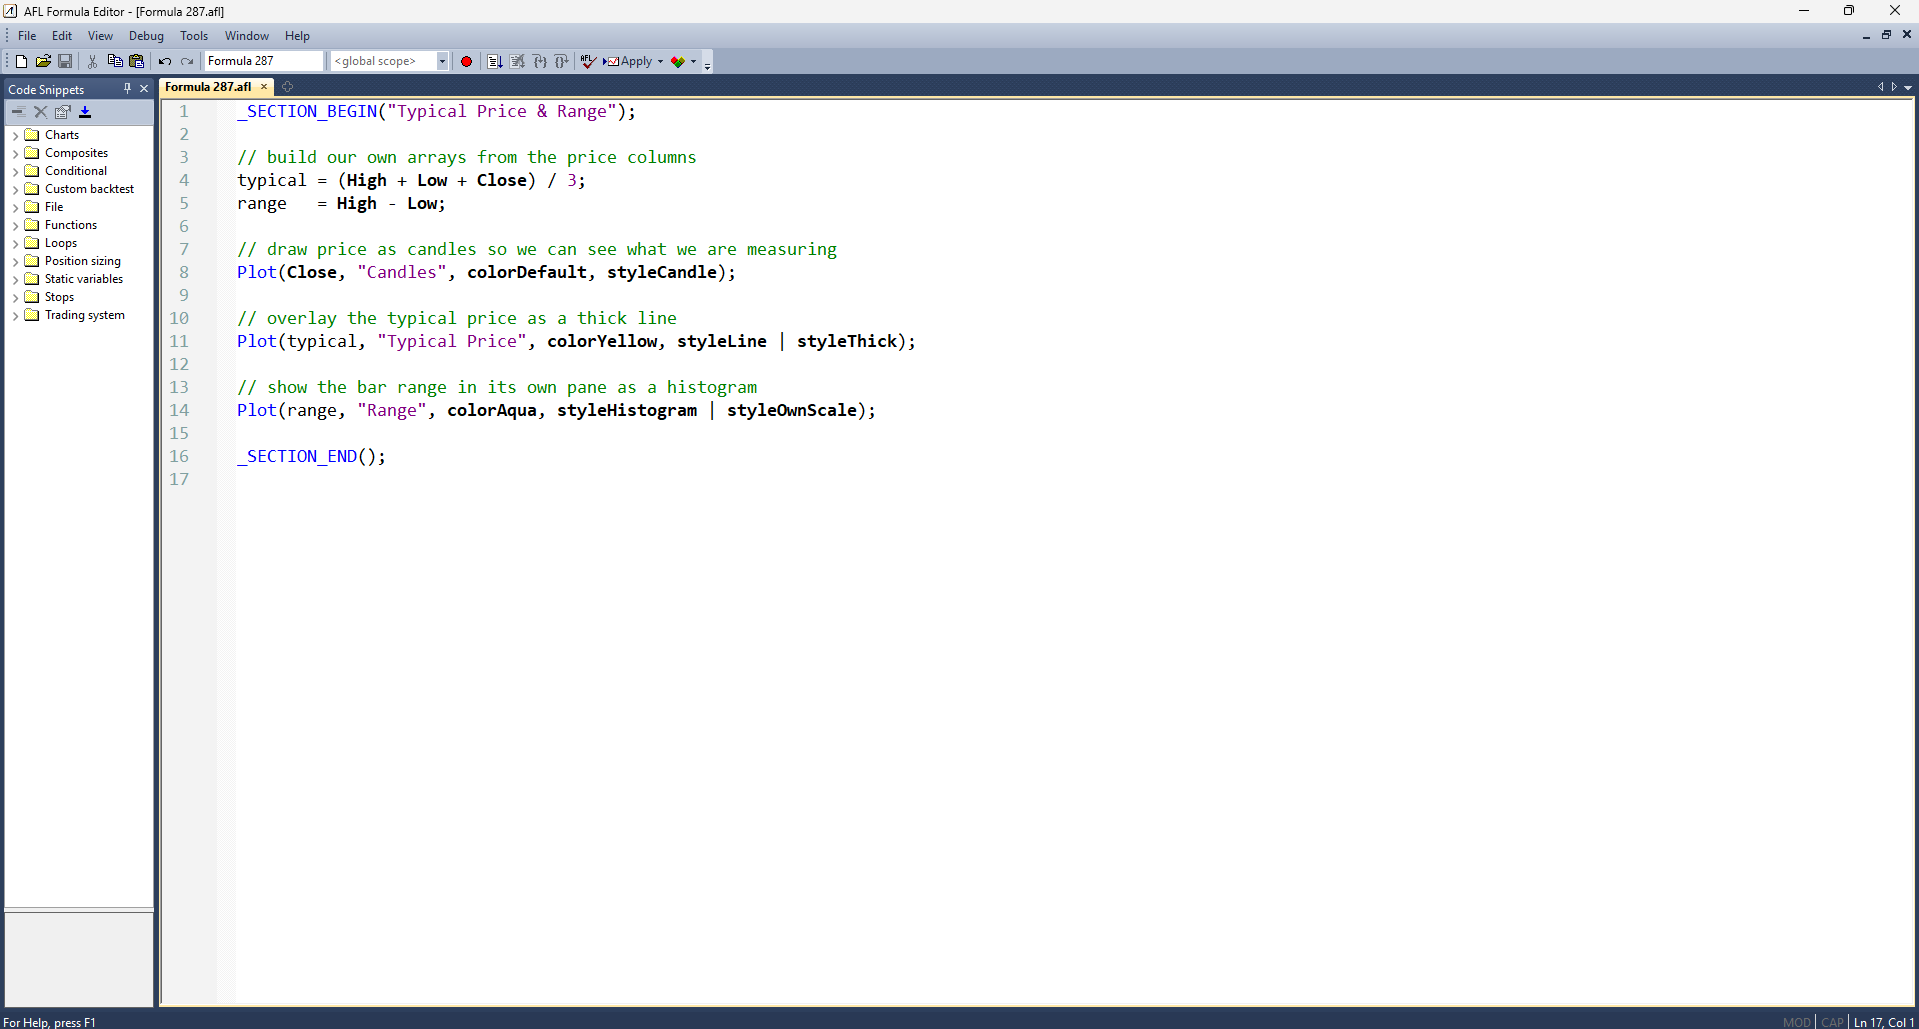
Let us combine these ideas into something you can apply and read. This plots the typical price and shades each bar's range, using only arithmetic on the price arrays:
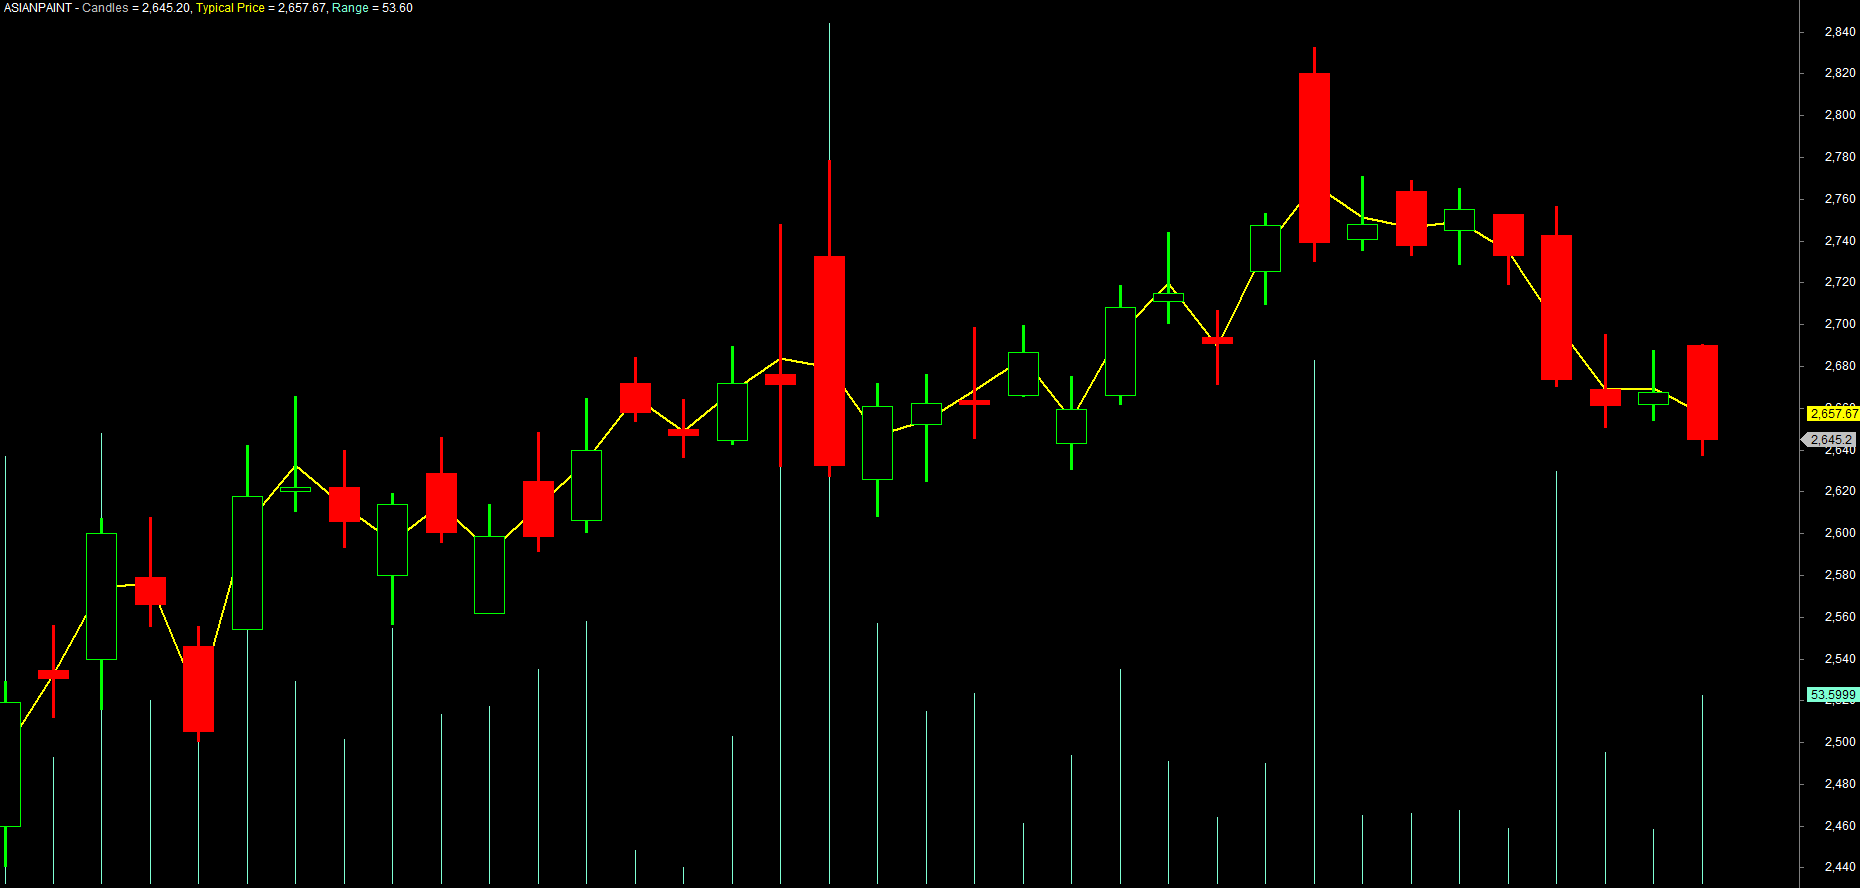
_SECTION_BEGIN("Typical Price & Range");

// build our own arrays from the price columns
typical = (High + Low + Close) / 3;
range   = High - Low;

// draw price as candles so we can see what we are measuring
Plot(Close, "Candles", colorDefault, styleCandle);

// overlay the typical price as a thick line
Plot(typical, "Typical Price", colorYellow, styleLine | styleThick);

// show the bar range in its own pane as a histogram
Plot(range, "Range", colorAqua, styleHistogram | styleOwnScale);

_SECTION_END();
Apply this to NSE RELIANCE and you will see the yellow typical-price line threading through the candles, with a range histogram pulsing larger on volatile days. Every line is just arithmetic on columns you already understand.
Reading values off the chart
You wrote columns of numbers - how do you check a single one? AmiBroker gives you two windows.
First, the Title (the text strip across the top of the chart). Anything you Plot automatically lists its value there for the bar under your cursor. Hover over a bar and the Title shows that bar's close, typical price, range and so on - one row of each array.
Second, the data window (right-click the chart -> Parameters area, or the floating cursor window) shows the same per-bar values in a neat list as you move the mouse. This is how you sanity-check a formula: hover over a bar, read range, and confirm it really equals that bar's high minus its low.
Plotting a value is also the easiest way to inspect it. If you are unsure what some variable contains, Plot it (even temporarily) and hover across the bars. Seeing the numbers beats guessing every time.
Try it yourself
- Write
body = abs(Close - Open);and plot it as a histogram. Which days have the largest candle bodies on NIFTY? - Plot both
(High + Low) / 2and(High + Low + Close) / 3on the same chart. Where do the two lines separate, and why? - Deliberately remove the brackets from
(High + Low + Close) / 3and Apply. Watch the line collapse, then put the brackets back - a one-minute lesson in precedence. - Hover across several bars and read
rangein the Title. Confirm by eye that it matches each candle's high-to-low height.
Recap
- AmiBroker provides six ready-made price arrays -
Open/High/Low/Close/Volume/OpenInt- with single-letter aliasesO/H/L/C/V. - Create your own variables with
name = expression;; the result is always a full column, one value per bar. - All arithmetic (
+ - * / %) acts across whole arrays, row by row. - The typical price
(H + L + C) / 3is a reusable building block worth remembering. - Operator precedence is BODMAS - brackets first, then
* /, then+ -; use brackets to be safe. - Read individual values back through the chart's Title and data window by hovering over a bar.
Next, we go deep on Plot() itself - lines, candles, histograms, colours and styles - so your indicators do not just calculate correctly, they communicate.