Reading the Backtest Report
Make sense of the numbers - net profit, CAR, drawdown, win rate, payoff and the risk-adjusted ratios.
- ·Net profit & CAR
- ·Max drawdown & MAR
- ·Win rate & payoff ratio
- ·Sharpe & expectancy
- ·Per-trade list
- ·Red flags in a report
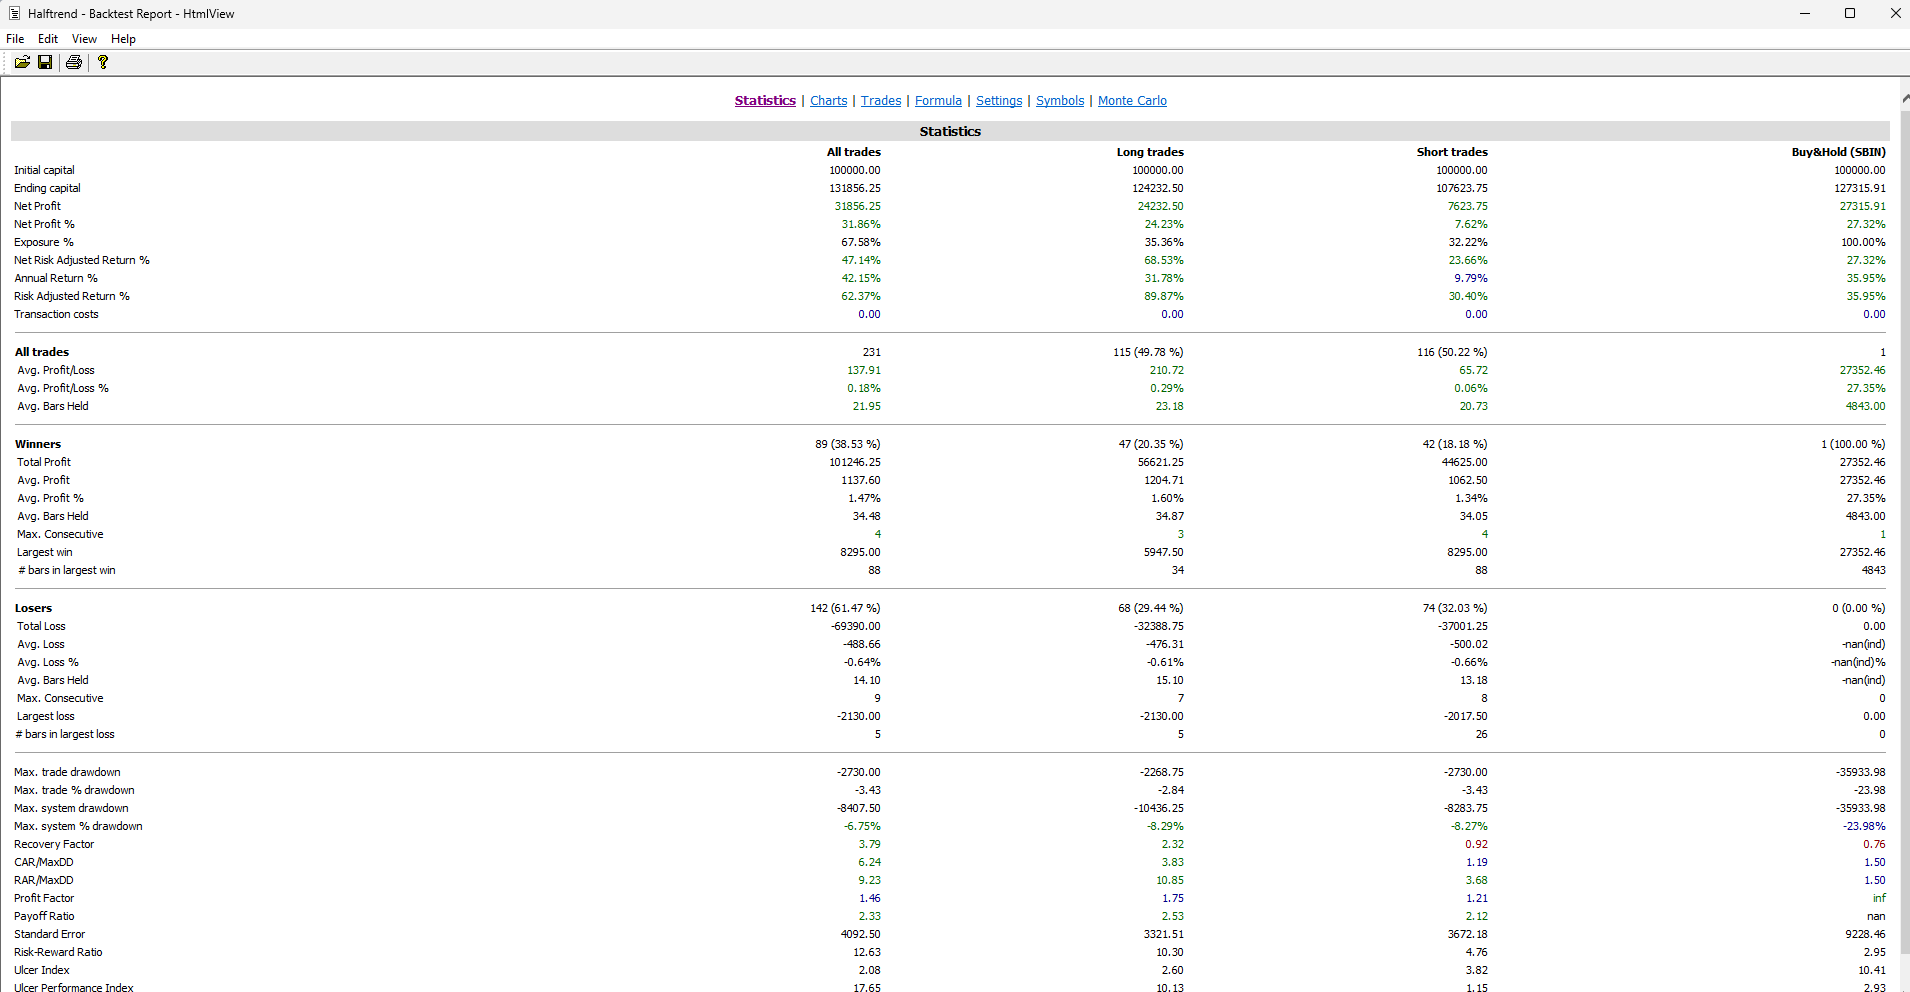
The backtest finishes and a report appears, dense with numbers - Net Profit, CAR, Max. system drawdown, Win rate, Payoff ratio, Sharpe, RAR. To a newcomer it is a wall of statistics. To a system trader it is a story: this is how the strategy made (or lost) money, how rough the ride was, and whether the edge is real or a fluke.
CAR/MDD - compound annual return divided by maximum drawdown - is the headline figure many AmiBroker users optimise for. It rewards a smooth ride over raw profit.
This chapter is a plain-English tour of that report. We will not drown in formulas - we will learn what each headline number means, what "good" roughly looks like for a swing system, and the red flags that should make you distrust an otherwise pretty result.
Opening the report
After a backtest, click the Report button in the Analysis window to open the full report. To revisit older runs, click the small drop-down arrow beside that button and choose Report Explorer - it lists every backtest you have run, and double-clicking a line reopens its detailed report. Inside, the statistics are split into three columns - All, Long and Short trades - so you can see whether your edge comes from both sides or just one. Not sure what a figure means? Hover your mouse over its name and AmiBroker shows a one-line description in a tooltip.
Since version 5.60 the report colour-codes the key metrics for you: green means "good", red means "bad" (a flag to investigate), blue means "neutral", and plain black means "not judged". The thresholds are deliberately rough - treat a red figure as advice to look closer, not an automatic fail - but they make a dense report far quicker to scan.
The report at a glance: good vs poor
Here is the whole report distilled into one cheat-sheet. The "Good" and "Poor" columns use AmiBroker's own colour-coding thresholds where it has them, and sensible guard-rails for a swing system everywhere else. Skim this first, then read the deep-dives below for the handful that matter most.
| Metric | What it tells you (plain terms) | Good (green) | Poor (red) |
|---|---|---|---|
| Net Profit % | Total return after costs | above 0 | below 0 |
| Annual Return % (CAR) | Compounded growth per year - the number to compare systems by | above 10% | below 0 (0-10% is modest) |
| Exposure % | How much of your capital is working in the market on average | enough to earn the return | high exposure for a small return |
| Risk-Adjusted Return (RAR) % | CAR adjusted for how exposed you were | above 10 / Exposure | below 0 |
| Expectancy (Avg P/L, $ and %) | The average you earn per trade | above 0 | below 0 |
| Profit Factor | Rupees won for every rupee lost | above 2 (over 1 = profitable) | below 1 |
| Payoff Ratio | Average win vs average loss | above 2 | below 1 (1-2 = ok) |
| Win Rate % | Share of trades that won - meaningless on its own | read together with Payoff | — |
| Max. system % drawdown | Deepest fall from a peak - the pain you must sit through | 0 to -10% | worse than -30% (-30 to -10 = caution) |
| CAR / MaxDD | Yearly return per unit of worst drawdown | above 2 | below 1 (1-2 = respectable) |
| RAR / MaxDD | Risk-adjusted return per unit of drawdown | above 2 | below 1 |
| Recovery Factor | Net profit per unit of worst drawdown - how fast it digs out | above 2 | below 1 |
| Sharpe Ratio | Return per unit of volatility (a smooth ride scores high) | above 1 (over 2 is very good) | below 1 |
| K-Ratio | How consistent the climb is, bar by bar | 1 or more (higher = steadier) | below 1 |
| Ulcer Index / Std. Error | How deep and how choppy the drawdowns and equity line are | lower | higher |
| Avg. Bars Held | How long an average trade lasts | matches your style and costs | — |
When in doubt about any figure, hover it in AmiBroker for the exact definition. The deep-dives below unpack the five that decide whether a system is worth keeping.
Net profit and CAR
Net profit is the obvious one: total money made minus money lost, after commissions, over the whole test. A big number feels great - but on its own it is almost meaningless, because it depends entirely on how long the test ran and how much capital it used. Doubling the years roughly doubles the profit without making the system any better.
That is why the number to trust is CAR - the Compound Annual Return, also shown as "Annual return %". It answers a far more useful question: what percentage did the account grow per year, on average, compounded? CAR lets you compare a 3-year test against a 10-year one fairly, and compare your system against a benchmark - if buying and holding the NIFTY returned, say, 12% a year over the same span, a system earning 11% with more effort and risk is not earning its keep.
Judge a system by CAR, not Net Profit. Net Profit grows just by testing longer; CAR is the per-year, compounded growth rate that lets you compare strategies and beat it against a simple buy-and-hold benchmark.
Max drawdown and the CAR-over-MDD idea
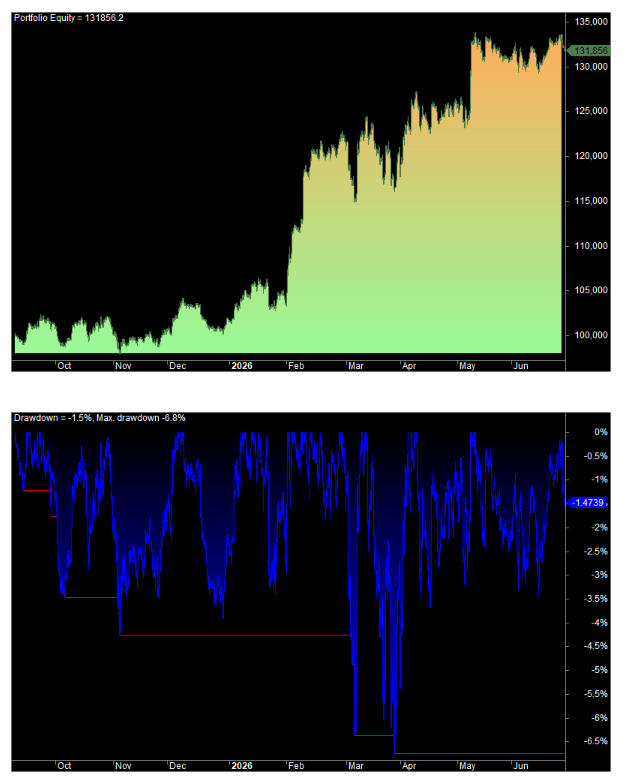
Maximum drawdown (Max. system drawdown, usually shown as a negative %) is the deepest peak-to-trough fall the equity curve ever suffered - the worst losing stretch, measured from a high-water mark to the bottom before a new high. This is the number that decides whether you could actually trade the system, because it is the pain you must endure to earn the return. A 40% drawdown means that at some point the account was down 40% from its peak - few people hold a system through that without panicking.
The two numbers only mean something together. A 30% CAR sounds wonderful until you learn it came with a 60% drawdown; a 15% CAR with a 10% drawdown is the calmer, more tradable system. Their ratio has a name - CAR/MDD (closely related to the MAR ratio): return divided by the worst drawdown.
- Below ~0.5: the return does not justify the pain.
- Around 1.0: respectable - you earn roughly your worst drawdown back each year.
- Above ~2.0: excellent, and worth double-checking it is not curve-fitted.
Win rate and payoff ratio
Win rate (% of winning trades) is the most over-rated number in trading. A 35% win rate can be wildly profitable, and an 80% win rate can lose money. It only makes sense paired with the payoff ratio - the average winning trade divided by the average losing trade (the report's "Ratio avg win/avg loss").
The two trade off against each other:
- Trend systems (like our EMA crossover) usually have a low win rate - maybe 35-45% - but a high payoff, because they cut losers fast and let a few big winners run. Most trades are small losses; a handful of large wins pay for them all.
- Mean-reversion systems tend to have a high win rate but a low payoff - many small wins, occasionally spoiled by a big loss.
Neither is "better". What matters is whether they combine into a positive expectancy.
A quick sanity check: a system wins if WinRate x AvgWin is bigger than LossRate x AvgLoss. A 40% win rate with a 2.5:1 payoff clears that bar comfortably; a 70% win rate with a 0.3:1 payoff does not. Always read win rate and payoff as a pair, never alone.
Expectancy
Expectancy rolls win rate and payoff into one number: the average profit (or loss) you can expect per trade, often shown in currency or as a percentage of risk. Positive expectancy means each trade, on average, adds money - the engine of all profit. Negative expectancy means no amount of position sizing or patience can save the system; it bleeds by design.
Expectancy also tells you how hard the system has to work. A small positive expectancy per trade can still build a great curve if the system trades often - but it leaves little room for slippage and costs to eat the edge. A larger expectancy per trade is more robust to the frictions of real trading.
Sharpe and risk-adjusted return
The report's Sharpe Ratio and RAR (Risk-Adjusted Return, AmiBroker's "Risk-adjusted annual return") both ask the same question in different ways: how much return did you earn per unit of risk? Sharpe divides return by the volatility (the choppiness) of the returns - a high Sharpe means a smooth ride, a low Sharpe means a jerky one even if the endpoint is the same.
A smoother curve is not just more pleasant - it is more trustworthy and easier to size up with leverage. As a rough guide for a swing system, a Sharpe around 1 is decent, above 1.5 is good, and anything boasting 3+ deserves suspicion that the test has been over-fitted to its data.
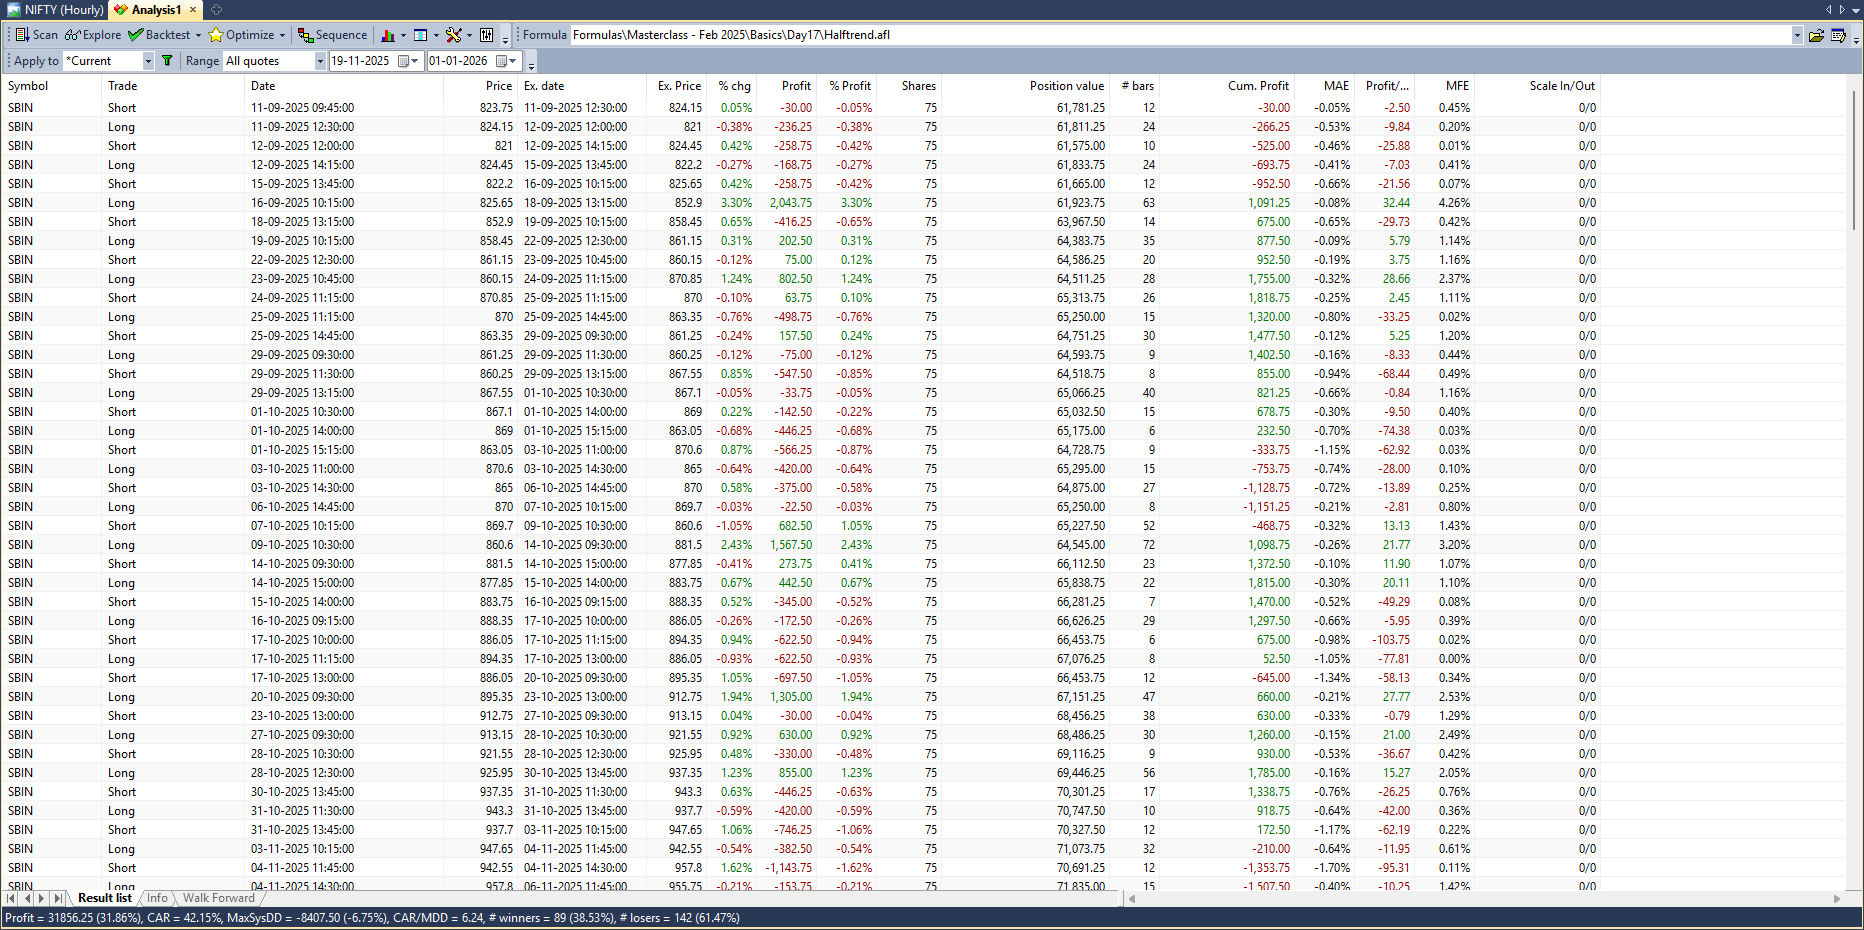
The per-trade list
Below the summary sits the trade list - every individual trade with its entry and exit date, price, profit, and (if a stop closed it) the exit reason. This is where you catch what the headline numbers hide. Scroll it and ask:
- Is the profit spread across many trades, or did one monster trade make the whole year? (Sort by profit to check.)
- How long are trades held - is that realistic for your style and costs?
- Are stops doing their job, or is one runaway loser dwarfing every winner?
- Did most trades happen in one short, lucky window, then nothing?
A summary can flatter; the trade list cannot hide.
Red flags in a report
Some patterns should make you distrust even a glowing summary:
- Too few trades. A handful of trades cannot prove an edge - the result is luck. Aim for at least 30-50 trades, and ideally a few hundred, before believing a statistic.
- One giant winner carrying the curve. Remove the single best trade; if the system turns mediocre, it has no real edge - it caught one lucky move.
- A deep drawdown you could never sit through, however high the return.
- An impossibly smooth curve or sky-high Sharpe on heavily optimised parameters - the tell-tale sign of curve-fitting, which we tackle in the optimisation chapter.
A good-looking backtest is a hypothesis, not a proof. Past performance never guarantees future results, and the numbers above describe one slice of history only. Treat every report as research to be challenged - and forward-test any promising system in sandbox trading (analyzer mode in OpenAlgo) before risking a rupee. This is education, not investment advice.
What "good" roughly looks like
For a daily swing system, a sensible, honest target zone is: a CAR that comfortably beats buy-and-hold, a maximum drawdown you could actually live through (often single-to-low-double-digit percent for a calm system), a CAR/MDD around 1 or better, a positive expectancy with enough trades behind it, and a Sharpe near or above 1. None of these is a magic threshold - they are guard-rails. A system that clears them and survives the red-flag checks is one worth carrying forward to optimisation and forward-testing.
Try it yourself
- Run your EMA system and write down five numbers: Net Profit, CAR, Max drawdown, Win rate, Payoff ratio. Which two would you keep if you could see only two?
- Compute CAR/MDD by hand from the report. Is it above 1?
- Sort the trade list by profit and delete (mentally) the single biggest winner. Does the system still look good?
- Compare your CAR against a buy-and-hold of the same symbol over the same dates. Did the system actually add value?
Recap
- Net Profit grows just by testing longer; judge a system by CAR (compound annual return) against a benchmark.
- Maximum drawdown is the worst peak-to-trough fall; read it with CAR via the CAR/MDD ratio (around 1 is respectable).
- Win rate means nothing without the payoff ratio - trend systems win less but pay more; both must combine into positive expectancy.
- Sharpe / RAR measure return per unit of risk - a smoother curve is more trustworthy; be suspicious of suspiciously high values.
- The per-trade list exposes what summaries hide; watch for too few trades, one giant winner, deep drawdown, and curve-fitting.
You can now build a system, clean it, protect it, size it, backtest it and read the result honestly - the complete loop of systematic trading. Next we sweep parameters with Optimize to choose robust settings without fooling ourselves.