Plotting & Chart Styles
Draw lines, candles, histograms and bands - and control colour, thickness and style like a pro.
- ·Plot() in depth
- ·styleLine / styleCandle / styleHistogram
- ·GetPriceStyle & styleNoTitle
- ·Colours and colorXXX constants
- ·Combining styles with |
- ·Plotting in a new pane
A correct indicator that looks like a mess teaches you nothing. A correct indicator drawn with the right style, colour and placement tells you the story at a glance. This chapter is about that second half - making Plot() communicate. We will go through every style you will reach for, learn the trick of combining them, and settle the eternal beginner question: does this line belong on the price, or in a pane of its own?
AFL styles are bit flags, which is why you combine them with | (styleLine | styleThick). Under the hood you are just switching on two separate bits in one number.
Plot, revisited
We met Plot() in Chapter 2. Here is its full common form:
Plot( array, "name", color, style );
array- the column of values to draw"name"- the label shown in the chart Title and legendcolor- one of AmiBroker's colour constants (more below)style- how to draw it: a line, candles, a histogram, and so on
The first two we understand. The colour and style arguments are where a chart goes from "technically a plot" to "actually readable", so let us spend our time there.
The style constants you will actually use
A style is a named constant - a word AFL recognises - that tells Plot how to render the array. These are the ones worth memorising:
styleLine- a plain line (the default for most indicators)styleCandle- draw the array as candlesticks (needs Open/High/Low data to look right; usually used for price)styleBar- OHLC bars, the western bar-chart lookstyleHistogram- vertical bars from the zero line up to each value; perfect for volume and MACDstyleArea- a line with the area beneath it filled instyleThick- thicken whatever you are drawing (a modifier, not a shape on its own)styleDots- draw discrete dots instead of a connected linestyleNoLabel- draw it but keep its value out of the TitlestyleDashed- a dashed line, handy for reference levels like a zero line
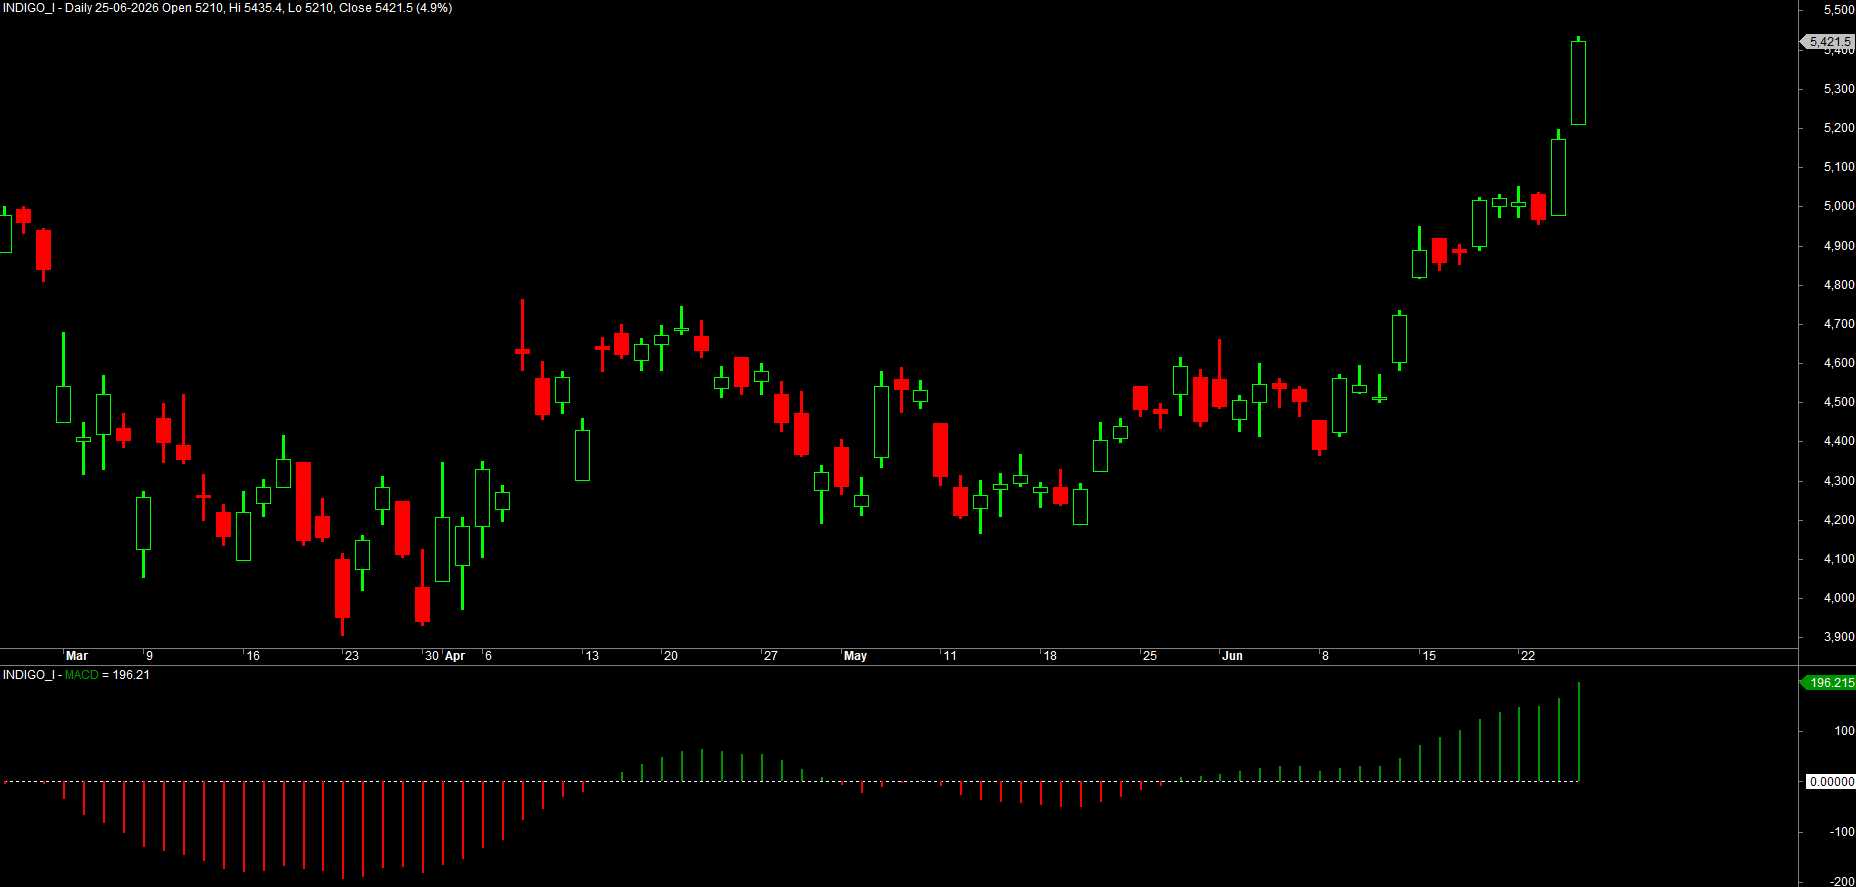
Here is a histogram pane - a coloured MACD, straight from the author's MACD Color Coding.afl:
_SECTION_BEGIN("MACD Histogram");

// the MACD line (12-26 by default)
imacd = MACD(12, 26);

// green when above zero, red when below - colour as a true/false-driven choice
mcolor = IIf(imacd > 0, colorGreen, colorRed);

// draw it as a thick histogram in its own pane
Plot(imacd, "MACD", mcolor, styleHistogram | styleThick);

// a dashed zero line for reference
Plot(0, "", colorWhite, styleDashed);

_SECTION_END();
Notice Plot(0, ...) - you can plot a constant. AFL treats the number 0 as a flat array at zero across every bar, giving you a clean reference line.
Combining styles with the | operator
Look again at styleHistogram | styleThick. That vertical bar | is the bitwise OR operator, and in AFL it means "switch on both of these options". Styles are designed to be stacked this way:
Plot(rs, "RSI", colorYellow, styleLine | styleThick);            // thick line
Plot(vol, "Volume", colorBlue, styleHistogram | styleNoLabel);  // histogram, hidden from Title
Plot(level, "", colorGrey, styleLine | styleDashed | styleNoLabel); // dashed, quiet line
You can OR together as many as make sense. A useful mental rule: pick exactly one shape (styleLine, styleCandle, styleHistogram, ...) and then add any number of modifiers (styleThick, styleDots, styleNoLabel, styleDashed). Mixing two shapes - say styleCandle | styleHistogram - just confuses the renderer.
The | here is not "or" in the English sense and it is not the logical OR you use in conditions. It is purely how AFL packs several on/off style switches into one argument. Read styleLine | styleThick simply as "line, and make it thick".
Colours: the colorXXX constants
AmiBroker ships a palette of named colour constants, all beginning color: colorRed, colorGreen, colorBlue, colorYellow, colorAqua, colorOrange, colorWhite, colorBlack, colorLightGrey, colorDarkGreen, and many more. Two special ones matter:
colorDefault- "use the chart's normal price colour" (green/red up/down candles). Use it when plotting price.colorCycle- "pick the next colour automatically", handy when stacking several averages.
For full control there is ColorRGB(red, green, blue), where each value runs 0-255 - so ColorRGB(255, 60, 60) is a soft red. You will reach for ColorRGB when the named palette does not have quite the shade you want; we use it heavily in the charting module.
Colour is information, not decoration. A consistent scheme - green for bullish, red for bearish, grey for neutral reference lines - lets your eye read a chart in a fraction of a second. Decide on a palette and stick to it across all your formulas.
Overlay on price, or a pane of its own?
This is the decision that trips up every beginner, and the rule is simple: match the scale.
- If your array is measured in the same units as price (a moving average, Bollinger Bands, VWAP, a Supertrend stop),
Plotit and it lands on the price pane, overlaying the candles. - If your array lives on a different scale (RSI 0-100, MACD around zero, volume in lakhs), it needs its own pane so it does not squash the price.
When you apply a formula to a fresh pane, AmiBroker gives it its own space automatically. To force an indicator onto an independent scale within a shared pane, add styleOwnScale:
// plot volume on its own scale so it does not flatten a price overlay
Plot(Volume, "Volume", colorBlue, styleHistogram | styleOwnScale | styleNoLabel);
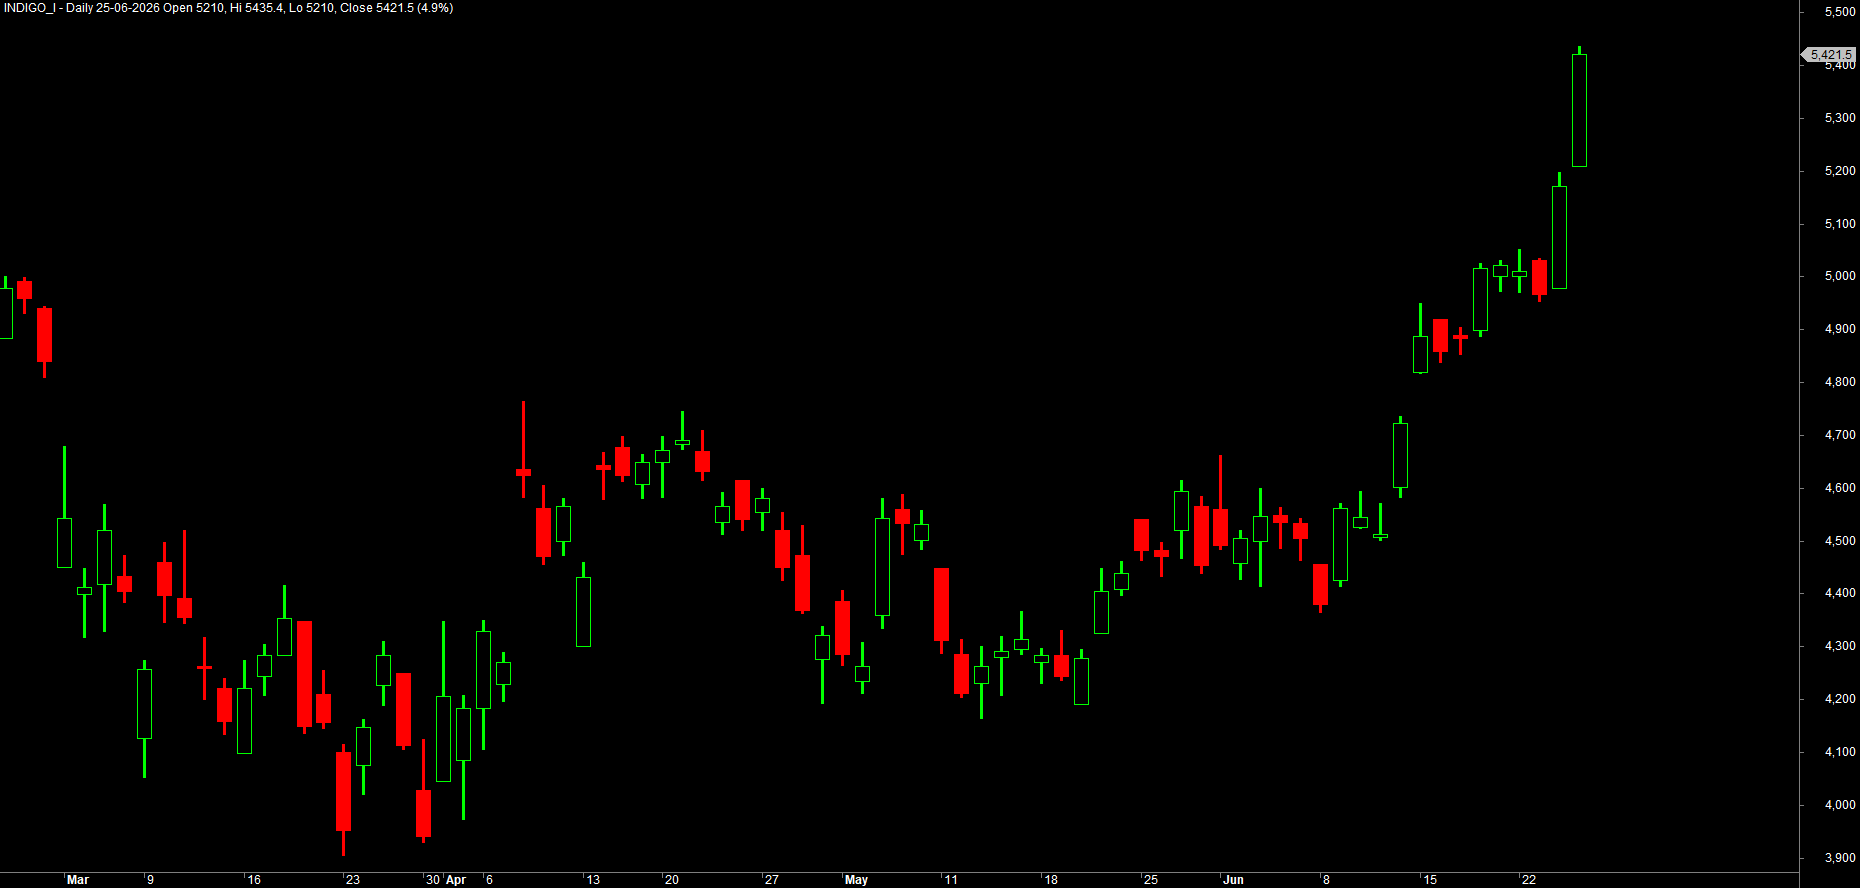
The professional price header
Open almost any polished AFL and the price plot looks like this idiom - worth adopting verbatim, grounded in the author's reference files:
_SECTION_BEGIN("Price");

// show buy/sell arrows and dates on the chart frame
SetChartOptions(0, chartShowArrows | chartShowDates);

// a dynamic Title showing name, interval, OHLC and percent change
_N(Title = StrFormat("{{NAME}} - {{INTERVAL}} {{DATE}} Open %g, Hi %g, Lo %g, Close %g (%.1f%%) {{VALUES}}",
    O, H, L, C, SelectedValue(ROC(C, 1))));

// draw price using the user's chosen price style, no duplicate title text
Plot(C, "Close", ParamColor("Color", colorDefault),
    styleNoTitle | ParamStyle("Style") | GetPriceStyle());

_SECTION_END();
Three pieces earn their keep. GetPriceStyle() returns whatever price style the user has selected in AmiBroker (candles, bars, line) so your formula respects their preference instead of forcing one. styleNoTitle suppresses the automatic value text because the custom Title line already shows OHLC. And _N(Title = ...) builds that rich header - we devote Chapter 14 to StrFormat and the Title, so for now just enjoy the result.
styleNoTitle hides a plot's value from the Title; styleNoLabel hides its axis label. GetPriceStyle() makes price honour the user's chosen candle/bar/line style. Together they are the polish that separates a hobby indicator from a professional one.
Try it yourself
- Take the MACD histogram and swap
styleHistogramforstyleArea, then forstyleLine. Which best shows momentum turning? - Plot a 20-bar MA three times - once
styleLine, oncestyleLine | styleThick, oncestyleDots- in three different colours, and compare readability. - Add
styleOwnScaleto a volume histogram sharing a pane with price, then remove it. Watch how it stops crushing the candles. - Replace
colorYellowwithColorRGB(255, 200, 0)and nudge the numbers to mix your own house colour.
Recap
Plot(array, "name", color, style)draws an array; the style decides the shape.- Core shapes:
styleLine,styleCandle,styleBar,styleHistogram,styleArea; modifiers:styleThick,styleDots,styleDashed,styleNoLabel,styleNoTitle. - Combine styles with the
|(bitwise OR) operator - one shape plus any number of modifiers. - Colours use
colorXXXconstants (orColorRGB(r,g,b));colorDefaulthonours the price colours,colorCycleauto-picks. - Match the scale: price-unit arrays overlay on price; differently-scaled arrays get their own pane (or
styleOwnScale). - The professional header uses
SetChartOptions, aStrFormatTitle,GetPriceStyle()andstyleNoTitle- adopt it as your standard price block.
Next, we make those hard-coded numbers - the 20, the 2, the colours - into sliders and dropdowns you can tweak without ever editing the code, using Param and friends.