Arrows, Shapes & Text
Mark signals on the chart with PlotShapes and PlotText - up arrows, down arrows, stars and labels.
- ·PlotShapes & shapeUpArrow
- ·Positioning with Offset
- ·Colour by condition
- ·PlotText for labels
- ·Stacking shapes
- ·Buy/Sell arrow conventions
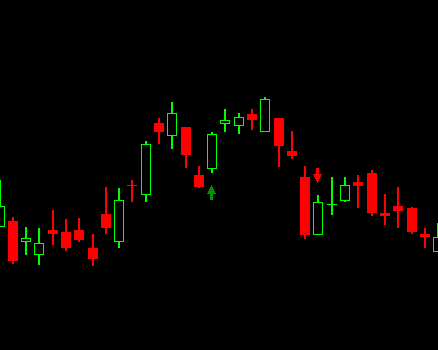
A line on a chart is useful, but a trader's eye is drawn to events - the exact bar where something happened. An arrow under a candle saying "buy here," a star marking an exit, the word "Short" stamped above a high. These marks turn a busy chart into a story you can read in a glance, and they are how every strategy you build from here on will announce its signals. In this chapter you learn to place them with PlotShapes and PlotText.
The good news: you already have everything you need. A signal is a true/false array (Chapter 8), and PlotShapes simply draws a chosen shape on every bar where that array is true. The craft is all in which shape, what colour, and where on the price scale it lands.
Did you know? AmiBroker's AFL engine is multi-threaded and uses every core of your CPU - a capability added back in 2010. That is why it can repaint a chart full of shapes, or scan a thousand symbols, without you ever waiting for it.
PlotShapes: a shape where a condition is true
The core call looks like this:
PlotShapes( shapeArray, color, layer, yPosition, offset );
The first argument decides which shape on which bar, and the standard idiom is an IIf that returns a real shape when your condition is true and shapeNone (draw nothing) when it is false:
_SECTION_BEGIN("Simple EMA Crossover with Signal Arrows");

fast = EMA(Close, 10);
slow = EMA(Close, 20);

Buy  = Cross(fast, slow);
Sell = Cross(slow, fast);

// up arrow under the low on Buy bars; nothing on other bars
PlotShapes(IIf(Buy,  shapeUpArrow,   shapeNone), colorGreen, 0, Low,  -20);
// down arrow over the high on Sell bars
PlotShapes(IIf(Sell, shapeDownArrow, shapeNone), colorRed,   0, High,  -20);

Plot( Close, "Price", colorDefault, styleCandle );

_SECTION_END();
The 0 is the drawing layer (leave it at 0 for now). The fourth argument, Low or High, is the y-array - the price level the shape attaches to on each bar. The last number is the offset.
PlotShapes draws on every bar where the shape array is non-zero. Wrapping your condition in IIf(cond, someShape, shapeNone) is the universal pattern: a shape appears only where cond is true, because shapeNone means "draw nothing here."
See a shape chosen per bar
The shape array is built by IIf just like any other array - it holds shapeUpArrow on the bars where the signal is true and shapeNone everywhere else. PlotShapes then walks that array and draws each shape at the price you passed as the y-array, here the bar's Low:
| Bar | 1 | 2 | 3 | 4 | 5 |
|---|---|---|---|---|---|
Buy |
F | T | F | T | F |
IIf(Buy, shapeUpArrow, shapeNone) |
none | up | none | up | none |
Low (where it is drawn) |
99 | 101 | 100 | 103 | 102 |
An up arrow appears only on the two Buy bars (2 and 4), each pinned just under that bar's low.
The shape menu
AmiBroker ships a set of named shape constants. The ones you will reach for constantly:
shapeUpArrow/shapeDownArrow- the classic buy/sell arrowsshapeSmallUpArrow/shapeSmallDownArrow- lighter weight versionsshapeSquare- a solid block, great as a coloured backdrop behind an arrowshapeStar- a star, popular for exits and special eventsshapeHollowCircle/shapeCircle- a ring or dot to flag a levelshapeDigit0...shapeDigit9- little numerals, handy for labellingshapeNone- the all-important "draw nothing"
Each is just a number under the hood, which leads to a neat shortcut you will see in the author's files: because true is 1 and false is 0, multiplying a condition by a shape constant gives you the shape on true bars and shapeNone (0) on false bars:
// these two lines do the same thing
PlotShapes(IIf(Sell, shapeStar, shapeNone), colorBrightGreen, 0, High, 12);
PlotShapes(Sell * shapeStar,                colorBrightGreen, 0, High, 12);
The cond * shape form is compact; the IIf form is clearer for beginners. Use whichever you find readable.
Positioning: the y-array and offset
Two arguments together decide where a shape sits. The y-array pins it to a price - pass Low to anchor shapes at the bottom of each candle, High to anchor them at the top. The offset then nudges it from that anchor, measured in screen pixels. Straight from the AmiBroker manual:
Offset is expressed in screen pixels. Negative offsets shift symbols down, positive offsets shift them up. (The default is
-12.)
So the sign is about screen direction - down or up - not about "above or below the candle". This catches everyone out once, so here is the rule that actually works: in the author's files you almost always see a negative offset on both arrows, exactly like the -20 in the example above.
// BOTH offsets are negative - the sign just means "push downward"
PlotShapes(IIf(Buy,  shapeUpArrow,   shapeNone), colorGreen, 0, Low,  -20);
PlotShapes(IIf(Sell, shapeDownArrow, shapeNone), colorRed,   0, High, -20);
- The buy up-arrow is anchored at the
Lowand pushed down, so it sits cleanly beneath the candle. - The sell/short down-arrow is anchored at the
Highand also pushed down, so it tucks just under the high, hugging the price it marks.
A larger magnitude (-30, -45) pushes the shape further down and away - which is exactly the lever the buy badge in the stacking convention uses to layer its shapes at -40, -45 and -50.
Colour by condition
The colour argument can be a constant like colorGreen, or it can itself be an IIf so the same PlotShapes call changes colour depending on the bar:
// one shape call, two colours: lime when also above the 50-EMA, plain green otherwise
strong = Close > EMA(Close, 50);
arrowColor = IIf(strong, colorLime, colorGreen);

PlotShapes(IIf(Buy, shapeUpArrow, shapeNone), arrowColor, 0, Low, -30);
That lets a single arrow carry two pieces of information at once - that a signal fired, and whether a secondary filter agreed.
The signal convention: chunky entry arrows, star exits
Open any of the author's strategy files and the four trade signals are drawn with one consistent, polished convention - and it is worth adopting wholesale, because it stays crisp even on a crowded chart. The two entries (Buy and Short) get a chunky three-layer arrow badge; the two exits (Sell and Cover) get a star:
/* Plot Buy and Sell Signal Arrows */
PlotShapes(IIf(Buy, shapeSquare, shapeNone),   colorGreen,  0, L, Offset=-40);
PlotShapes(IIf(Buy, shapeSquare, shapeNone),   colorLime,   0, L, Offset=-50);
PlotShapes(IIf(Buy, shapeUpArrow, shapeNone),  colorWhite,  0, L, Offset=-45);

PlotShapes(IIf(Short, shapeSquare, shapeNone),    colorRed,    0, H, Offset=40);
PlotShapes(IIf(Short, shapeSquare, shapeNone),    colorOrange, 0, H, Offset=50);
PlotShapes(IIf(Short, shapeDownArrow, shapeNone), colorWhite,  0, H, Offset=-45);

PlotShapes(Sell  * shapeStar, colorBrightGreen, 0, High,  12);
PlotShapes(Cover * shapeStar, colorRed,         0, Low,  -12);
Why three calls per entry? Stacking two coloured squares just behind one another builds a chunky two-tone block, and the white arrow lands right on top of it. That layering is the whole trick: it makes the marker look far bigger and more elegant than a lone thin arrow, and it stays readable even when the chart is busy. The green/lime up-arrow says "go long" at the low; the red/orange down-arrow says "go short" at the high. Keeping the two squares about ten points apart is what gives each badge its two-tone depth.
The two exits use the compact cond * shapeStar shortcut from earlier: because Sell and Cover are 1/0 arrays, multiplying by shapeStar draws a star where the exit fires and nothing elsewhere. A bright-green star marks a long being closed (Sell, at the high); a red star marks a short being covered (Cover, at the low).
So each of the four reserved signals gets its own unmistakable mark - a green badge-arrow to enter long, a red badge-arrow to enter short, a green star to exit long, a red star to exit short. This is the exact set you will reuse in every strategy in the playbook.
Build each badge from back to front: plot the biggest, darkest square first, the brighter square slightly offset next, and the white arrow last. Because each PlotShapes call draws over the previous ones, whatever you plot last sits cleanly on top - which is why the arrow always ends up crowning the squares.
PlotText: words on the chart
Sometimes a symbol is not enough and you want an actual label. PlotText writes a string at a given bar and price:
PlotText( "Buy", barNumber, yPrice, textColor, backgroundColor );
Because it needs a specific bar number, PlotText is normally driven by a short for-loop that walks the bars and writes a label wherever the signal is true - the pattern straight from the author's Supertrend file:
for( i = 0; i < BarCount; i++ )
{
    if( Buy[i] )   PlotText("Buy",   i, Low[i],  colorWhite, colorLime);
    if( Sell[i] )  PlotText("Sell",  i, High[i], colorWhite, colorRed);
}
For each bar where Buy[i] is true, it stamps the word "Buy" at that bar's low with a green background; sells get "Sell" at the high in red. Labels like these make a printed chart self-explanatory.
Text is heavier to draw than shapes. A handful of labels is fine, but writing text on hundreds of bars will slow a chart noticeably - and clutter it past the point of being readable. Prefer shapes for dense signals and save PlotText for the few marks that truly need words.
Try it yourself
- Plot a 10/20 EMA crossover and mark buys with
shapeUpArrowbelow the low, sells withshapeDownArrowabove the high. - Adopt the four-signal convention - chunky badge-arrows for
Buy/Shortentries andshapeStarexits forSell/Cover- and tune the offsets until the marks sit clearly off the candles. - Colour your buy arrow lime when price is also above its 50-EMA and plain green otherwise, using an
IIfin the colour slot. - Add a
for-loop that writes "Buy" / "Sell" labels withPlotText, then compare how it reads against arrows alone.
Recap
PlotShapes(IIf(cond, shape, shapeNone), color, 0, yArray, offset)draws a shape on every bar wherecondis true.- Useful shapes include
shapeUpArrow,shapeDownArrow,shapeSquare,shapeStar,shapeHollowCircle- andshapeNoneto draw nothing. - The y-array (
Low/High) pins a shape to a price; a negative offset drops it below the bar, a positive offset lifts it above. - The colour argument can be an
IIf, so one call can change colour by condition. - The author's signal convention stacks two squares plus a white arrow for entries (
Buy/Short) and uses ashapeStarfor exits (Sell/Cover) - bold, readable marks for all four signals. PlotTextwrites words at a specific bar and price, usually from a shortfor-loop - powerful but heavier, so use it sparingly.
Next we go beyond marks to full colour - painting candles by trend, laying ribbons along the bottom and shading the background for instant context.