Stops, Targets & ApplyStop
Add a stop-loss and profit target - both as visual chart levels and as real backtest exits with ApplyStop.
- ·Fixed & percent stops
- ·ATR-based stops
- ·Visual stop/target plots
- ·ApplyStop stopTypeLoss / Profit
- ·Trailing stops
- ·Stops in the backtest
A system that only knows how to enter and exit on signals has a blind spot: what happens when a trade goes wrong fast, before the exit signal arrives? An EMA crossover might not flash Sell for many bars while the price bleeds away beneath you. Professional systems answer this with stops (a line in the sand where you admit the trade failed) and targets (a level where you happily take profit).
ApplyStop can apply loss, profit, trailing and even N-bar time stops inside the backtester, evaluated bar-by-bar at their true intrabar levels - something a plain Sell array simply cannot do.
In this chapter we do it two ways. First we draw stop and target lines on the chart so we can see them. Then we make them real in the backtest with one powerful built-in command, ApplyStop, so the engine actually exits when a level is hit.
Fixed, percent and ATR stops
A stop is just a price level computed from your entry. There are three common flavours:
- Fixed (points): a set number of rupees below entry, e.g.
entry - 15. Simple, but ignores how volatile the stock is. - Percent: a fraction of the entry price, e.g.
entry * (1 - 0.5/100)for a 0.5% stop. Scales with price, which is why it is so popular. - ATR-based: a multiple of Average True Range, e.g.
entry - 2 * ATR(14). This is the smartest of the three because ATR measures recent volatility - the stop sits wider on a wild stock and tighter on a calm one, so normal noise does not knock you out.
A target is the same idea in the other direction - above entry for a long, below for a short.
A stop sized in ATR adapts to the market automatically. 2 * ATR(14) is roughly "twice the recent average bar range" - far enough that ordinary wiggle will not stop you out, close enough that a genuine reversal will. It is the author's default for volatility-aware exits.
Drawing the levels on the chart
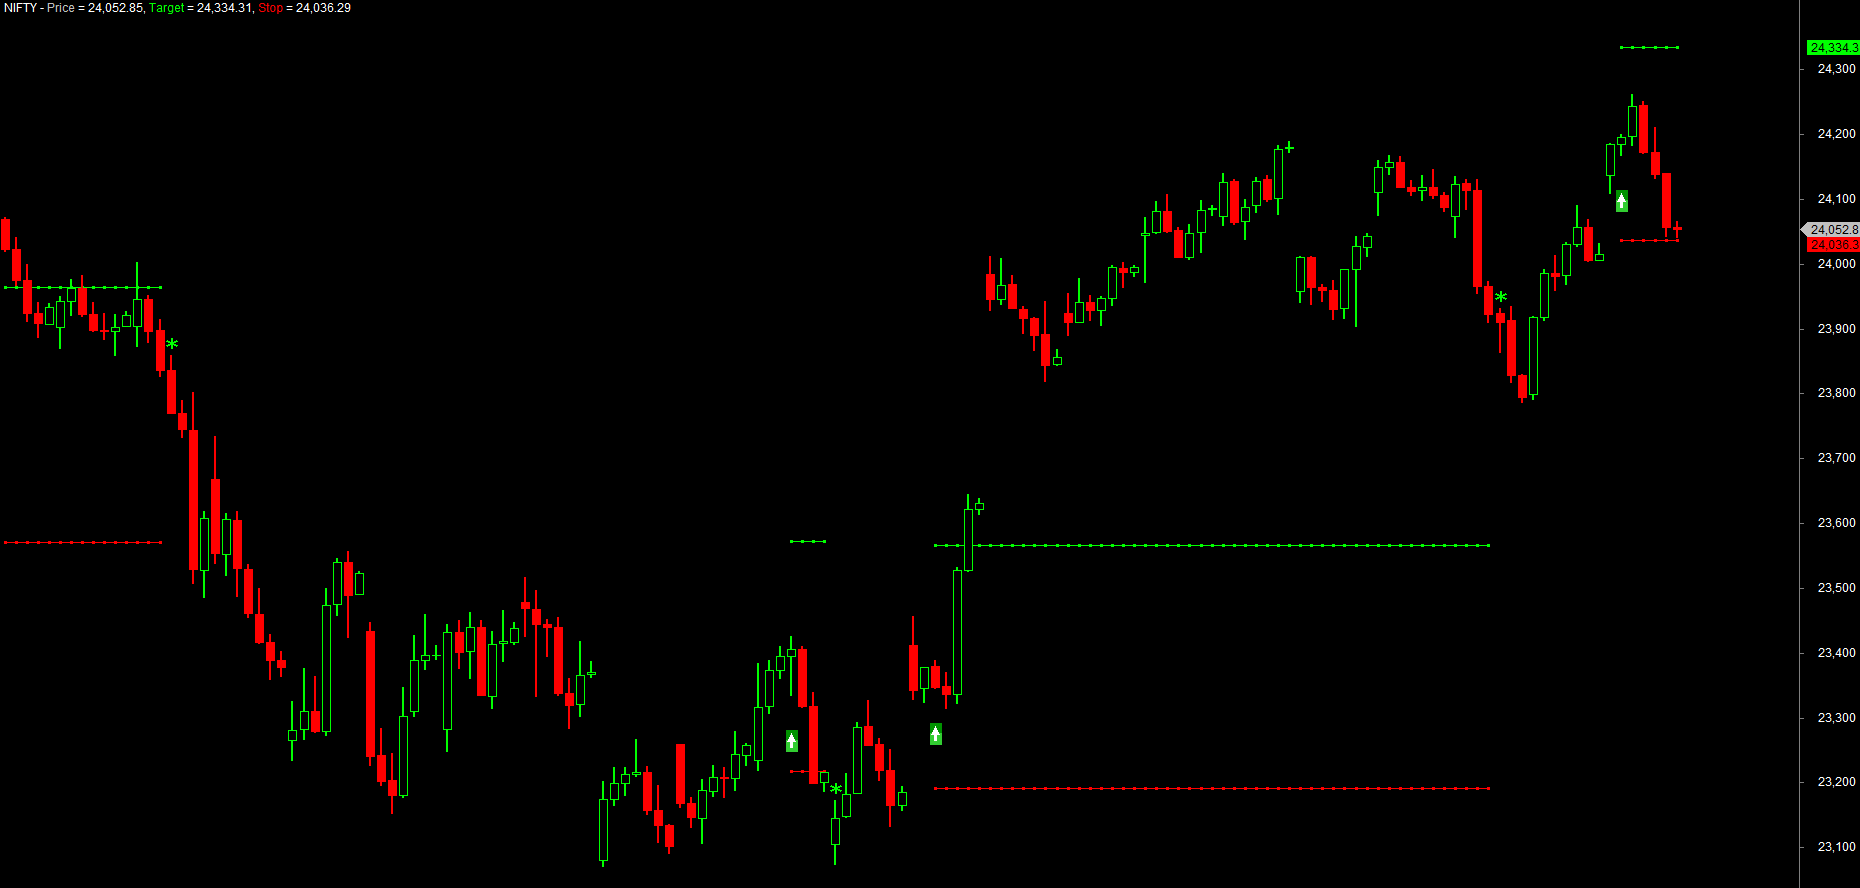
Before trusting a stop, it helps to see it. Building on the clean EMA system from the last chapter, we compute the entry with ValueWhen, derive the stop and target, and plot them only while a trade is open using Flip. This mirrors the author's Stoploss and Target Visual Plot.afl:
_SECTION_BEGIN("EMA System with Visual Stop and Target");

Fast = EMA(Close, 10);
Slow = EMA(Close, 20);
Plot(Close, "Price", colorDefault, styleCandle);

// clean, non-repainting signals (Chapter 21)
Buy  = Ref(Cross(Fast, Slow), -1);
Sell = Ref(Cross(Slow, Fast), -1);
Buy  = ExRem(Buy,  Sell);
Sell = ExRem(Sell, Buy);
SetTradeDelays(0, 0, 0, 0);

// lock BOTH the entry price AND the entry-bar ATR, so the levels stay flat
BuyPrice   = ValueWhen(Buy, Open);       // entry = next bar open, held forward
atrAtEntry = ValueWhen(Buy, ATR(14));    // ATR captured AT the entry bar, held forward

// --- stop and target, fixed from the entry bar ---
Target = BuyPrice + 2 * atrAtEntry;      // ATR-based profit target
Stop   = BuyPrice - 2 * atrAtEntry;      // ATR-based stop-loss

// show them only while the trade is live
inLong = Flip(Buy, Sell);
Plot(IIf(inLong, Target, Null), "Target", colorBrightGreen, styleLine | styleDots);
Plot(IIf(inLong, Stop,   Null), "Stop",   colorRed,         styleLine | styleDots);

/* Plot Buy and Sell Signal Arrows */
PlotShapes(IIf(Buy, shapeSquare, shapeNone),   colorGreen,  0, L, Offset=-40);
PlotShapes(IIf(Buy, shapeSquare, shapeNone),   colorLime,   0, L, Offset=-50);
PlotShapes(IIf(Buy, shapeUpArrow, shapeNone),  colorWhite,  0, L, Offset=-45);

PlotShapes(Sell  * shapeStar, colorBrightGreen, 0, High,  12);

_SECTION_END();
The detail that makes this correct: lock the ATR at the entry bar with ValueWhen(Buy, ATR(14)), exactly the way you lock the entry price. If you instead write Stop = BuyPrice - 2 * ATR(14) using the live ATR(14), that value changes on every bar, so the stop and target lines wobble up and down rather than staying flat at the level you actually set on entry. Capture the price and the ATR once, at entry, and hold both with ValueWhen.
The signal marks follow the course convention: the chunky green badge-arrow flags each Buy entry under the low, and a bright-green star marks each Sell exit at the high. The IIf(inLong, Target, Null) pattern is the key to the levels - Null means "draw nothing", so the green target line and red stop line appear the instant a trade opens and vanish the instant it closes, exactly the picture a discretionary trader wants while watching the position.
Be clear about what this block does and does not do: it only draws the stop and target as lines on the chart - it is purely visual. It does not make the system exit when price touches a level; the trade still closes only on the Sell signal. Turning these levels into real, enforced exits in the backtest is a separate step, and that is exactly what ApplyStop does in the next section.
For a percent stop instead of ATR, swap the two lines:
Target = BuyPrice * (1 + 1.0/100);   // 1% target
Stop   = BuyPrice * (1 - 0.5/100);   // 0.5% stop
These drawn levels are visual only - they make a chart you can read, but they do not yet force the backtester to exit. For that we need ApplyStop.
ApplyStop: real exits in the backtest
ApplyStop tells the backtest engine to watch for a stop or target on every bar of every trade and close the position the moment one is touched - no signal required. Its shape is:
ApplyStop( type, mode, amount, exitAtStop );
- type - what kind of stop:
stopTypeLoss(stop-loss),stopTypeProfit(profit target), orstopTypeTrailing(a trailing stop that follows price). - mode - how
amountis measured:stopModePercent(a percentage),stopModePoint(points/rupees), orstopModeDisable(off). - amount - the size, e.g.
2for 2% in percent mode. This can be a single number or an array, which is how ATR stops are wired in. - exitAtStop - set to
Trueto exit intra-bar exactly at the stop price when the bar's high/low touches it;Falsechecks only on the close.
Here is a complete, realistic exit block. A 0.5% stop, a 1% target, and a 1% trailing stop, all active at once:
// stop-loss: exit 0.5% below entry
ApplyStop( stopTypeLoss, stopModePercent, 0.5, True );

// profit target: exit 1% above entry
ApplyStop( stopTypeProfit, stopModePercent, 1.0, True );

// trailing stop: lock in gains, trail 1% behind the best price
ApplyStop( stopTypeTrailing, stopModePercent, 1.0, True );
To make the stop adapt to volatility, feed an ATR array in point mode instead of a fixed percent:
// ATR-based stop: 2 x ATR(14) in rupee points, as an array
ApplyStop( stopTypeLoss, stopModePoint, 2 * ATR(14), True );
ApplyStop works for shorts automatically. The same stopTypeLoss that sits below a long entry sits above a short entry - you do not write separate code for each side. The engine knows which way the trade is facing.
How stops show up in the backtest
When you run the backtest (next chapter), a trade closed by ApplyStop appears in the trade list with an exit reason - "Stop", "Profit target" or "Trailing stop" - rather than "Sell". That label is gold when you are debugging: it tells you why each trade ended. You will typically see more, smaller losers (the stop cutting them early) and capped winners (the target taking profit), which usually lowers the average loss and tames the drawdown.
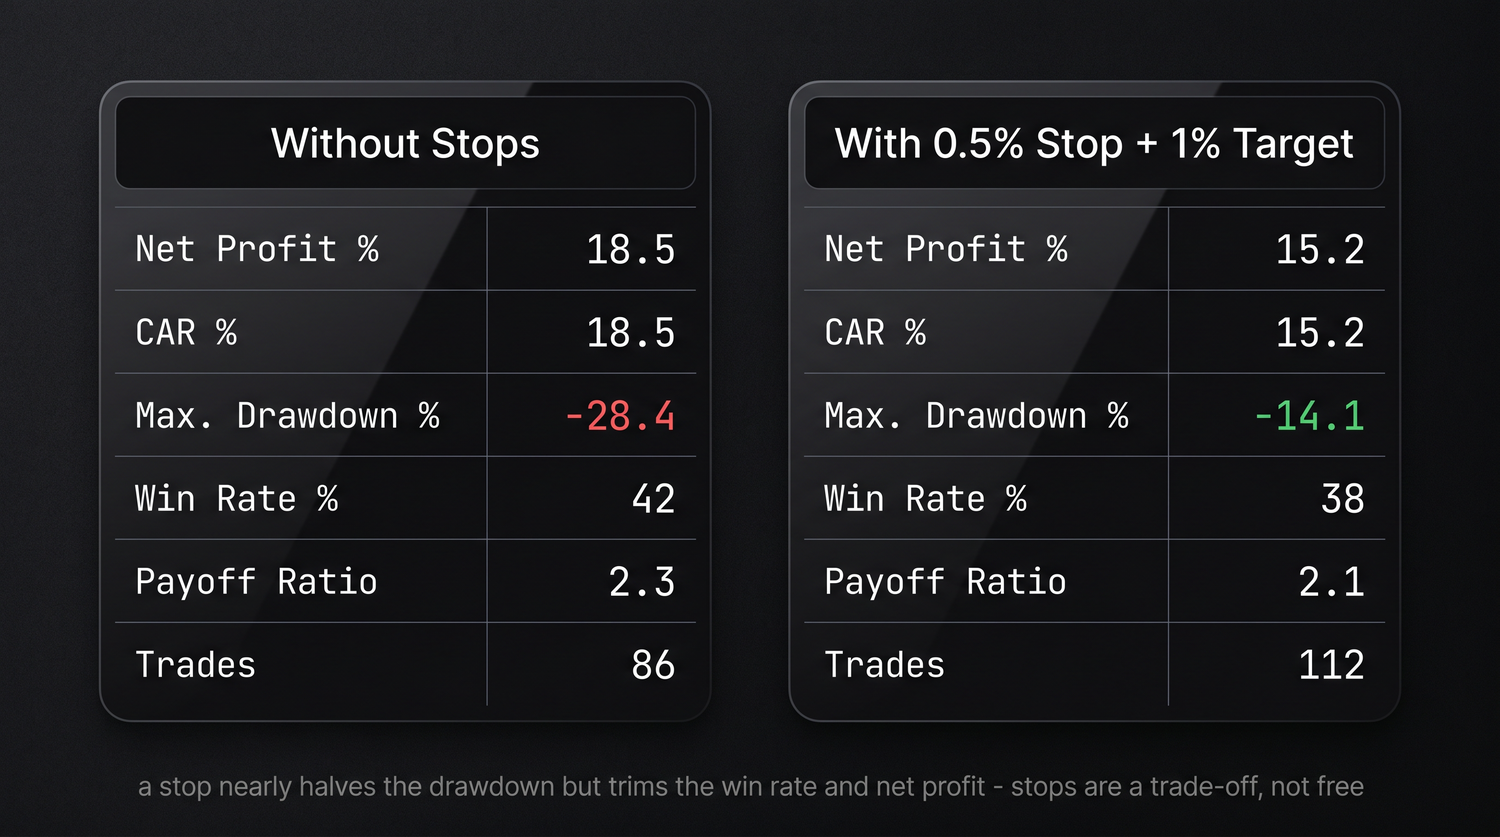
A caution worth internalising: tight stops are not free. A stop that is too close gets hit by ordinary noise, turning would-be winners into a string of small losses and often hurting the system. The honest way to judge a stop is to backtest the system both with and without it and compare the reports side by side - not to assume "a stop must help."
Adding a stop almost always changes a system's character, and not always for the better. Always run the backtest twice - once without ApplyStop, once with - and compare net profit, win rate and maximum drawdown. Let the numbers, not your intuition, decide whether the stop earns its place.
Try it yourself
- Add the visual
Target/Stopplot to your EMA system and Apply it to a daily chart. Watch the lines bracket each long trade. - Switch the stop from
2 * atrAtEntryto a flatBuyPrice * (1 - 0.5/100)percent stop and compare how tight the red line sits. - Add all three
ApplyStoplines, run a backtest, and open the trade list - read the exit reason on each closed trade. - Tighten the stop to
0.2%and loosen it to2%. Which one quietly destroys the win rate? This is why you always test, never assume.
Recap
- Stops and targets are price levels derived from the entry - fixed, percent, or ATR-based (
entry - 2 * ATR(14)), the last adapting to volatility. - Draw levels with
Plot(IIf(inLong, Stop, Null), ...)so they appear only while a trade is open - visual only, no exits. ApplyStop(type, mode, amount, exitAtStop)enforces real exits:stopTypeLoss,stopTypeProfit,stopTypeTrailing, measured instopModePercentorstopModePoint.amountcan be an array, which is how an ATR stop plugs in; stops apply to longs and shorts automatically.- Stops change a system's behaviour - always backtest with and without and compare before keeping one.
Next, we decide how much to trade and when fills happen - position sizing with SetPositionSize, trade timing with SetTradeDelays, and the account settings that make a backtest realistic.