Multiple Panes & Comparing Symbols
Stack indicator panes, and pull in another symbol's data with Foreign and PlotForeign for relative strength.
- ·New pane vs overlay
- ·Foreign() to read another symbol
- ·PlotForeign on the chart
- ·Relative strength vs an index
- ·SetForeign / RestorePriceArrays
- ·Spread & ratio charts
Up to now every formula has worked on one symbol at a time - the one whose chart you are looking at. But traders rarely think about a stock in isolation. Is RELIANCE leading or lagging the NIFTY? Is BANKNIFTY stronger than the broad index today? To answer that, a single formula needs to read two symbols at once: the one on the chart, and a benchmark.
Foreign() lets a single formula read a completely different symbol's data - it is how a relative-strength line or an index trend filter pulls in the index without ever leaving your stock's chart.
AmiBroker gives you exactly that with Foreign, PlotForeign and SetForeign. In this chapter we stack indicator panes, pull another symbol's data into the current one, and build the classic relative-strength line that shows leadership at a glance.
A new pane vs an overlay
First, a quick refresher on where a plot lands. Every Plot call goes into a pane:
- Overlay - the plot shares the price pane. Moving averages, bands and the price candles all sit together because they share the same price scale.
- New pane - the plot gets its own strip below the price, with its own vertical scale. RSI, MACD and a relative-strength line belong here, because their numbers are nothing like a stock price.
You choose by adding styleOwnScale or by plotting in a separate _SECTION that AmiBroker places in a new pane when you apply it as a fresh indicator. For comparisons, a new pane is almost always what you want - you do not want a ratio of 1.04 squashed against a price of 24,000.
Foreign: reading another symbol
Foreign( "TICKER", "field" ) returns an array from a different symbol, perfectly aligned to the dates of the chart you are on. The field is a single letter: "O", "H", "L", "C" or "V".
// Read the NIFTY close while sitting on a stock's chart
niftyClose = Foreign( "NIFTY", "C" );

Plot( niftyClose, "NIFTY Close", colorBlue, styleLine | styleOwnScale );
Because Foreign aligns by date, you can now do maths between the chart symbol and the benchmark on equal footing - bar for bar.
Use the ticker exactly as it appears in your database. A continuous-futures series is often named with a suffix such as NIFTY-I; a cash index might just be NIFTY. If Foreign returns nothing, the ticker string is almost always the culprit - check it in the symbol list.
PlotForeign: a one-liner to draw another symbol
When you only want to draw another symbol - no maths - PlotForeign is the shortcut. It is Foreign and Plot rolled into one:
SetChartOptions( 0, chartShowArrows | chartShowDates );

symbol = ParamStr( "Compare Symbol", "NIFTY-I" );

// Draw the chosen symbol in its own pane as candles
PlotForeign( symbol, symbol, colorBlue, styleCandle );
Using ParamStr for the ticker turns it into a typed-in parameter, so you can switch the compared symbol from the Parameters window without editing code - handy for flipping between NIFTY and BANKNIFTY.
Relative strength: who is leading?
Here is the payoff. Relative strength is simply your symbol divided by a benchmark. When the line rises, your stock is outperforming the index; when it falls, it is lagging - regardless of whether the broad market is up or down.
// Relative strength of the chart symbol vs the index
index = Foreign( "NIFTY-I", "C" );
rs    = Close / index;

// A smoothed version makes the trend clearer
rsAvg = EMA( rs, 20 );

Plot( rs,    "RS vs NIFTY", colorWhite, styleLine | styleOwnScale );
Plot( rsAvg, "RS 20-EMA",   colorOrange, styleLine | styleOwnScale );
A rising rs while the market falls is a strong tell: the stock is being held up by buyers when everything else is being sold. That is the kind of leadership that does not show on a price chart alone.
Relative strength = your symbol / a benchmark. The absolute level of the line is meaningless - only its direction matters. Up means leading, down means lagging. Plot it in its own pane with styleOwnScale.
See relative strength bar by bar
Foreign("NIFTY", "C") pulls the index close in as its own date-aligned column, sitting right beside the stock's Close. Dividing the stock by the index gives a ratio that rises when the stock outperforms and falls when it lags, no matter which way the broad market moves:
| Bar | 1 | 2 | 3 | 4 | 5 |
|---|---|---|---|---|---|
Close (RELIANCE) |
1310 | 1325 | 1318 | 1342 | 1360 |
Foreign("NIFTY","C") |
24500 | 24600 | 24560 | 24580 | 24600 |
rs = Close / index |
0.0535 | 0.0539 | 0.0537 | 0.0546 | 0.0553 |
The ratio climbing through bars 4 and 5 means RELIANCE is gaining on the index, even on bars where its raw price barely moved.
SetForeign and RestorePriceArrays
Foreign reads one field at a time. Sometimes you want to run a whole indicator on another symbol - say a 20-day ATR of the NIFTY - without rewriting it field by field. SetForeign( "TICKER" ) temporarily swaps the built-in O, H, L, C, V arrays to point at that symbol. Every function you call after it runs on the foreign symbol. When you are done, RestorePriceArrays() switches back to the chart symbol.
// Compute an indicator on the index, then return to our symbol
SetForeign( "NIFTY-I" );
   indexATR   = ATR( 14 );        // ATR of NIFTY, not our stock
   indexAbove = Close > MA( Close, 50 );  // index trend filter
RestorePriceArrays();

// Back on our symbol now - O,H,L,C,V are ours again
Plot( Close, "Close", colorDefault, styleCandle );
Always pair SetForeign with RestorePriceArrays(). If you forget, the rest of your formula keeps reading the foreign symbol's prices by mistake - a confusing bug where your stock's plot looks like the index. Treat them like an opening and closing bracket.
Spread and ratio charts
The same two-symbol idea gives you two more classic studies:
- A ratio chart divides one symbol by another (
A / B) - exactly the relative-strength idea, often used for pairs like GOLD vs SILVER or one index vs another. - A spread chart takes the absolute gap between them with
abs(A - B)- useful when the two trade in similar units and you care about how far apart they are, whichever one is higher. Wrapping it inabs()keeps the spread positive so it is easy to read and compare.
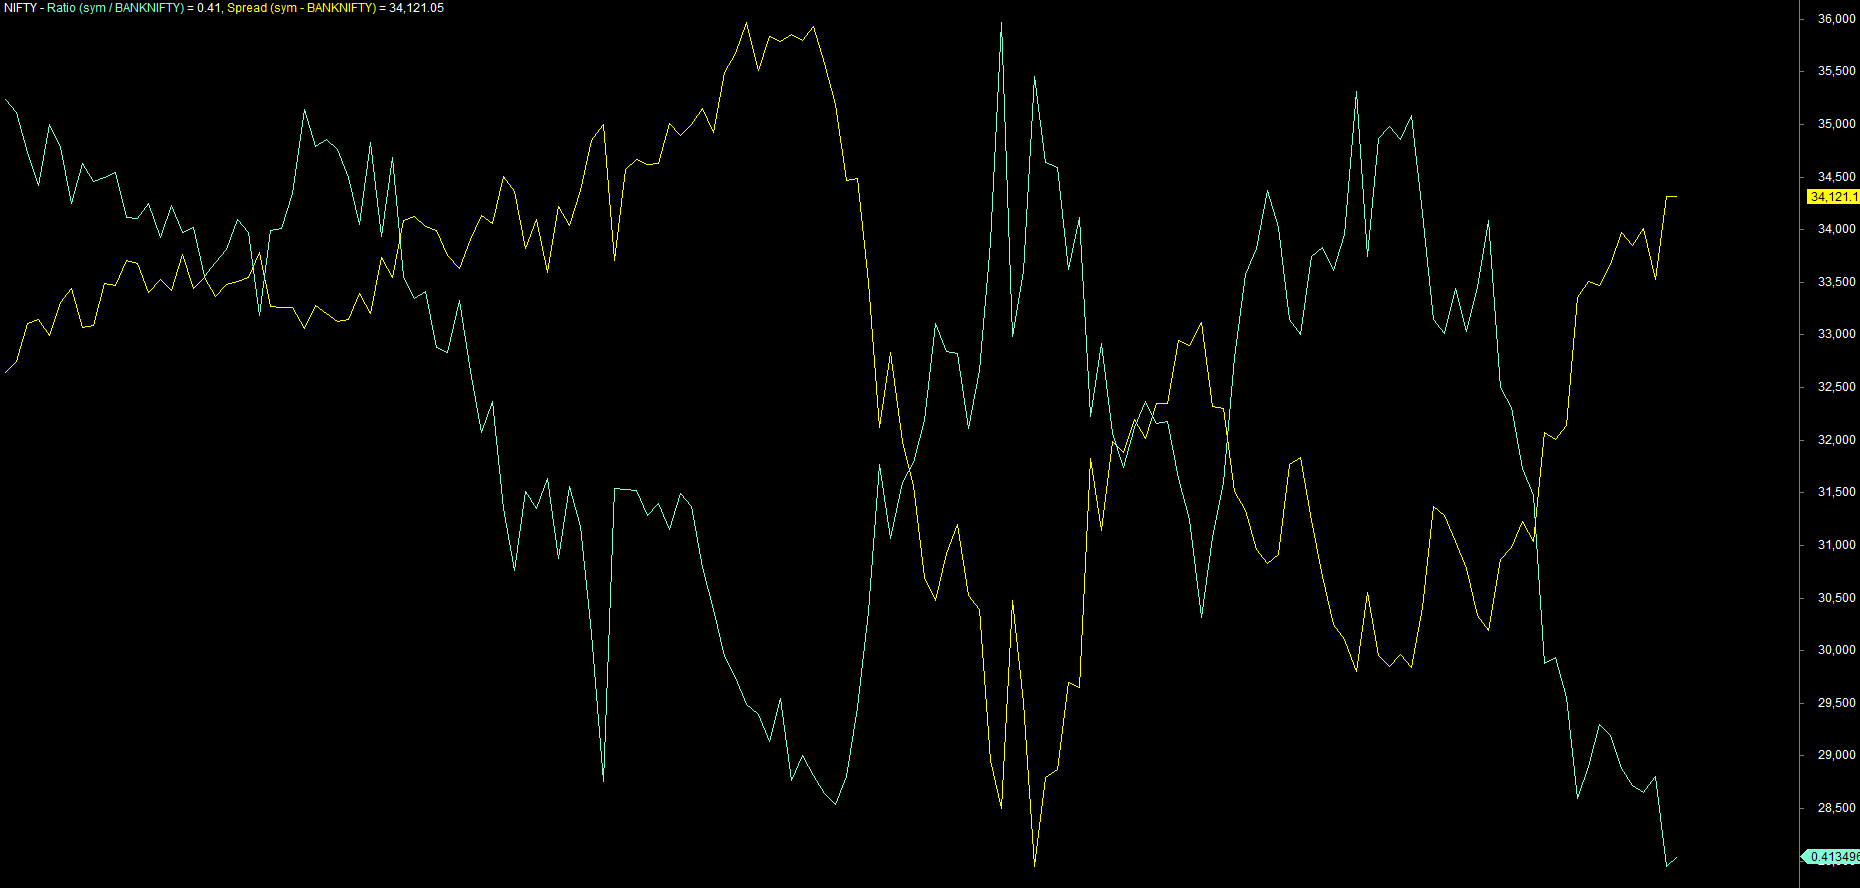
_SECTION_BEGIN("Spread");

a = Close;                       // NIFTY symbol (Current Active Charts)
b = Foreign( "BANKNIFTY", "C" ); // the other leg

ratio  = a / b;
spread = abs(a - b);

Plot( ratio,  "Ratio (NIFTY / BANKNIFTY)", colorAqua,   styleLine | styleOwnScale );
Plot( spread, "Spread abs(NIFTY - BANKNIFTY)", colorYellow, styleLine | styleOwnScale );

_SECTION_END();
Watching a ratio mean-revert - stretching away from its average and snapping back - is the visual heart of pairs trading. You can layer the header from the previous chapter on top so the exact ratio under your cursor is always printed.
A correlation table is the natural next step: instead of one ratio, you loop a watchlist and measure how each symbol moves with a benchmark using Correlation( Close, Foreign(other,"C"), period ). We build full watchlist tables in the Exploration module - the same Foreign call is the engine underneath.
Try it yourself
- Plot the relative strength of any stock vs NIFTY and find a week where it led while the index fell.
- Use
ParamStrso you can switch the benchmark between NIFTY and BANKNIFTY without editing the code. - With
SetForeign, draw a background ribbon that is green only when both the stock and the index are above their 50-day moving averages. - Build a GOLD / SILVER ratio in its own pane and add a 20-period average to spot stretches.
Recap
- A comparison plot almost always belongs in a new pane with
styleOwnScale. Foreign("TICKER","field")reads one date-aligned field from another symbol;PlotForeigndraws another symbol in one line.- Relative strength is your symbol divided by a benchmark - direction is what matters.
SetForeign/RestorePriceArraysrun whole indicators on a foreign symbol, then switch back.- Ratios and spreads are the two-symbol building blocks for pairs and leadership studies.
Next we go beyond lines and panes entirely, drawing our own pixel-perfect panels with the low-level GFX functions.