Looking Back: Ref, Cross & BarsSince
Reach into earlier (and later) bars with Ref, detect crossovers with Cross, and count bars since an event.
- ·Ref() to shift an array
- ·Yesterday's close, prior high
- ·Cross() for crossovers
- ·BarsSince & Barssince logic
- ·HHV / LLV over a window
- ·Avoiding look-ahead bias
Every interesting trading idea has a sense of time baked into it. "Price closed above yesterday's high." "RSI just crossed up through 30." "It has been twelve bars since the last signal." None of those questions can be answered by looking at the current bar alone - you have to peek at earlier bars and compare. This chapter gives you the three tools that let an array look over its own shoulder: Ref, Cross and BarsSince.
These functions are the backbone of almost every real system you will ever write. They are also where a careless formula can start cheating by accidentally reading the future - so we will end with the one rule that keeps your signals honest.
Ref: shifting an array in time
Ref(array, n) gives you the value of array shifted by n bars. A negative n reaches backward in time; a positive n reaches forward. By far the most common is -1, "the previous bar":
yesterdayClose = Ref(Close, -1);   // each bar now holds the PRIOR bar's close
priorHigh      = Ref(High, -1);    // the previous bar's high

// today closed above yesterday's high?
breakout = Close > Ref(Close, -1);
Think of Ref(Close, -1) as the whole close array slid one step to the right, so that at each bar you are looking at the value that used to be one bar to the left. That is all "yesterday's close" really is - the close array shifted by one.
You can reach further back too. Ref(Close, -5) is the close five bars ago, which lets you measure change over a window without any loops:
fiveBarChange = Close - Ref(Close, -5); // net move over the last five bars
Ref with a positive number looks into the future. Ref(Close, +1) is tomorrow's close - data that did not exist when the bar formed. Using it in a trading signal is called look-ahead bias, and it produces backtests that look brilliant and lose money live. We use positive Ref only to illustrate a point, never inside a Buy or Sell rule.
Cross: catching the exact moment lines meet
A crossover is not "A is above B" - that stays true for many bars. A crossover is the single bar where A moves from below to above B. AFL has a dedicated function for it:
fast = EMA(Close, 10);
slow = EMA(Close, 20);

goldenCross = Cross(fast, slow);   // true only on the bar fast crosses ABOVE slow
deathCross   = Cross(slow, fast);   // true only on the bar slow crosses above fast
Cross(a, b) is true on exactly the one bar where a rises through b. It is worth seeing what it really is underneath, because it demystifies the whole thing - it is just yesterday's chapter combined with this one:
// these two lines are equivalent
goldenCross = Cross(fast, slow);
goldenCross = fast > slow AND Ref(fast, -1) <= Ref(slow, -1);
In words: "fast is above slow now, AND on the previous bar fast was not above slow." That transition - false yesterday, true today - is the crossover. Once you see Cross as nothing more than "above now, was below before," you will never be confused by it again.
// mark the crossovers on the chart
PlotShapes(IIf(goldenCross, shapeUpArrow,   shapeNone), colorGreen, 0, Low,  -20);
PlotShapes(IIf(deathCross,  shapeDownArrow, shapeNone), colorRed,   0, High,  20);
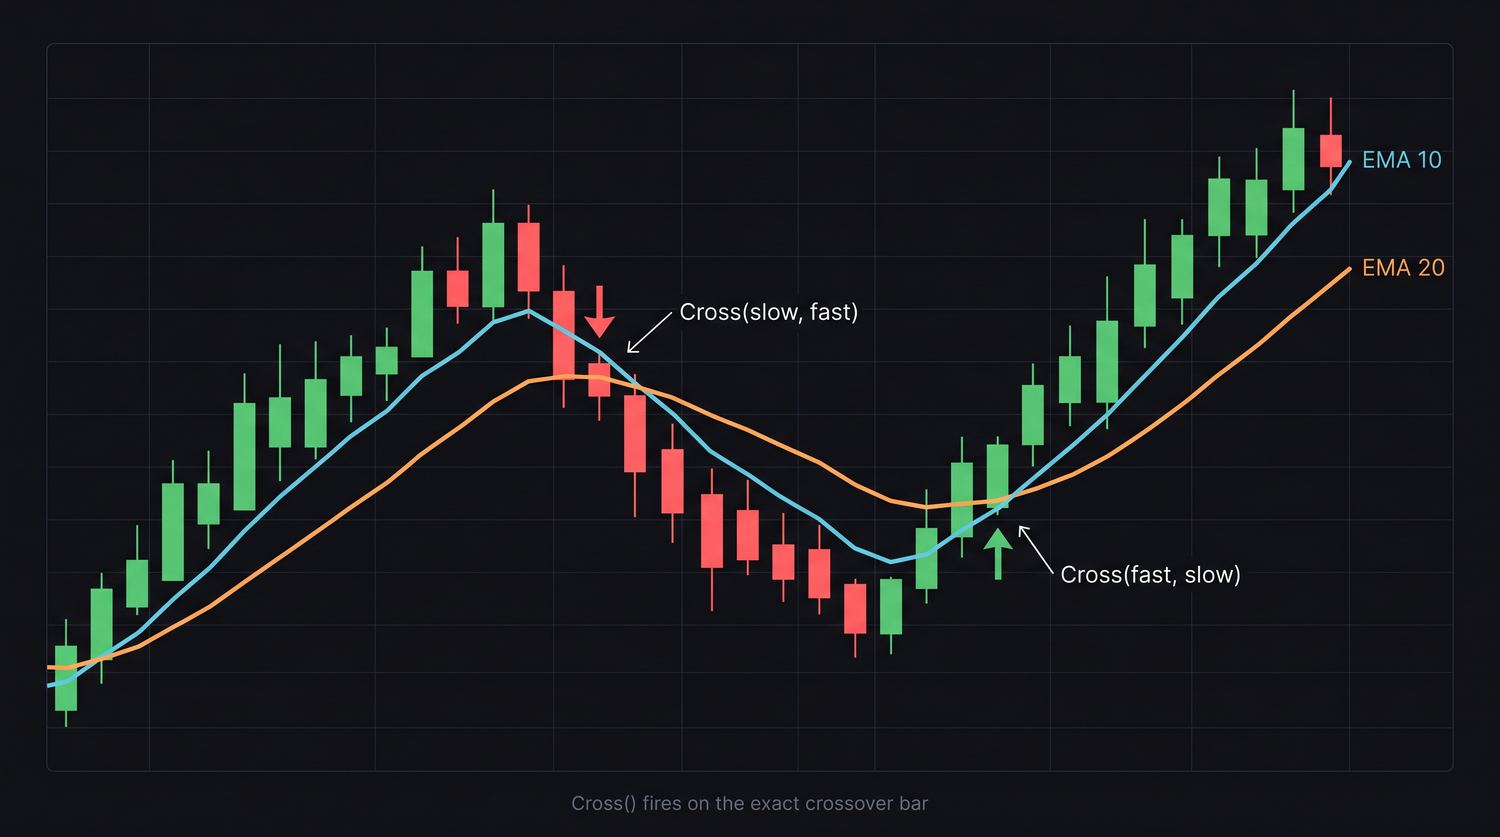
Cross only fires on a clean transition, so it never repeats while one line stays above the other. That is exactly what you want for an entry signal: one arrow per crossover, not a fresh arrow on every bar of the trend.
BarsSince: counting bars since an event
BarsSince(condition) counts how many bars have passed since a condition was last true. It returns 0 on the bar the event happens and climbs by one each bar afterwards until the event happens again. The author's own teaching example counts the days since a market crash:
dailyReturns = ROC(Close, 1);        // one-bar percentage change
event        = dailyReturns <= -5;   // a 5% or worse down day

daysSince = BarsSince(event);        // bars since the last crash day

Plot(daysSince, "Days Since the Crash", colorYellow, styleHistogram | styleThick);
BarsSince is a quiet workhorse. It lets you build time-based rules with no loop at all - "only enter if it has been at least 5 bars since the last exit," or "skip the first 3 bars of the session":
cross   = Cross(EMA(Close,10), EMA(Close,20));
freshOK = BarsSince(cross) <= 3;     // true for the first few bars after a cross
BarsSince is built on the same idea as Sum of a true/false array - because conditions are 1s and 0s, counting and timing them is just arithmetic. Almost everything "stateful" in AFL is secretly a count of true/false flags.
Watch Cross and BarsSince, bar by bar
These functions click the instant you trace them across a few bars. First Cross. Watch the one bar where fast finally pokes above a flat slow - that single transition is the only True:
| Bar | 1 | 2 | 3 | 4 | 5 | 6 |
|---|---|---|---|---|---|---|
fast |
9 | 10 | 11 | 12 | 13 | 12 |
slow |
11 | 11 | 11 | 11 | 11 | 11 |
fast > slow |
F | F | F | T | T | F |
Cross(fast, slow) |
F | F | F | T | F | F |
Look closely at bar 5: fast is still above slow, so fast > slow is true - but Cross is false, because there was no transition; it was already above on bar 4. Cross only ever marks the crossing bar itself, which is why it makes such a clean entry signal.
Now BarsSince. Take an event - an oversold bar where RSI(14) < 30 - and count how many bars have passed since it last happened. The count resets to 0 on each event and climbs by one afterwards:
| Bar | 1 | 2 | 3 | 4 | 5 | 6 | 7 | 8 |
|---|---|---|---|---|---|---|---|---|
RSI(14) < 30 |
F | T | F | F | T | F | F | F |
BarsSince(...) |
– | 0 | 1 | 2 | 0 | 1 | 2 | 3 |
It is 0 on the bar the event fires (bars 2 and 5), then ticks up one per bar until the next event resets it. The dash on bar 1 is a real gotcha: until the condition has been true even once, BarsSince simply keeps counting up from the very first bar, so guard those early bars if your logic depends on them.
HHV, LLV, Highest and Lowest over a window
Looking back over a window of bars is so common that AFL gives it dedicated functions. HHV(array, n) is the highest value of the array over the last n bars; LLV(array, n) is the lowest. They are the heart of every breakout and channel system:
upperChannel = HHV(High, 20);        // highest high of the last 20 bars
lowerChannel = LLV(Low, 20);         // lowest low of the last 20 bars

// a 20-bar Donchian-style breakout (uses the PRIOR channel to stay honest)
breakoutUp = Close > Ref(HHV(High, 20), -1);
Notice the Ref(..., -1) on the channel: we compare today's close against the highest high as of yesterday, so the current bar's own high cannot inflate the level it is trying to break. That small shift is the difference between a real breakout test and an accidental look-ahead.
Highest(array) and Lowest(array) are the same idea over the entire history so far, while HHVBars / LLVBars tell you how many bars ago the extreme occurred - useful for "new 20-day high today" style tests.
The one rule: never look ahead in a signal
Everything in this chapter can reach across time, and that power cuts both ways. The single most important discipline in system building is this:
A trading signal may only use information that existed at the close of the signal bar. That means negative Ref only, channels shifted back with Ref(..., -1), and never a positive Ref inside a Buy, Sell, Short or Cover rule. Break this and your backtest is trading on tomorrow's news.
When a backtest looks too good to be true, the first thing a seasoned trader checks is look-ahead bias - a stray +1 shift, or a level that secretly includes the current bar. Build the honest habit now, while the formulas are small, and it will protect every system you write later.
Try it yourself
- Plot
Ref(Close, -1)over the price as a dashed line and watch it lag one bar behind - that is "yesterday's close." - Rebuild
Cross(fast, slow)by hand usingfast > slow AND Ref(fast,-1) <= Ref(slow,-1)and confirm the arrows land on the same bars. - Use
BarsSinceto count the bars since RSI was last below 30, and plot it as a histogram. - Build a 20-bar high breakout with
Close > Ref(HHV(High,20), -1)and mark each breakout with an up arrow.
Recap
Ref(array, n)shifts an array in time - negative looks back, positive looks forward;Ref(Close,-1)is yesterday's close.Cross(a, b)fires on the one bararises throughb, and equalsa > b AND Ref(a,-1) <= Ref(b,-1).BarsSince(condition)counts bars since an event - the easy way to build time-based rules without loops.HHV/LLV(andHighest/Lowest) give the extreme over a window - the basis of channels and breakouts.- Shift channels back with
Ref(..., -1)so the current bar cannot rig its own breakout level. - Never use a positive
Refin a signal - look-ahead bias makes backtests lie.
Next we meet the rare case where arrays alone cannot do the job - state that depends on its own previous answer - and learn to write a clean, controlled for-loop.