Colours, Ribbons & Conditional Candles
Colour candles by trend, paint background ribbons and build at-a-glance visual context.
- ·IIf-driven colours
- ·Colouring candles by a rule
- ·Trend ribbons at the bottom
- ·Background shading
- ·MACD / RSI colour coding
- ·colorXXX vs ColorRGB
Colour is the fastest language a chart can speak. Before you read a single number, a green candle says "up" and a red one says "down"; a band of green along the bottom of the screen says "the trend is your friend right now." A well-coloured chart lets you grasp the state of the market in a heartbeat - and the tools behind it are ones you already know. Everything in this chapter is IIf choosing a colour, plus a few new Plot styles that turn those colours into candles, ribbons and shaded backgrounds.
This is where your charts stop looking like a beginner's and start looking like a trading desk's. And it costs almost nothing - a colour array here, a style flag there.
Did you know? In 2021 AmiBroker introduced QuickAFL's QuickGFX rendering, which made chart drawing up to 40 times faster. That speed is exactly why you can colour every candle, paint ribbons and shade backgrounds in real time without the chart ever feeling sluggish.
Colours are just values - and arrays
A colour in AFL is a value like colorGreen or colorRed. The leap that unlocks this whole chapter is that a colour can also be an array - a different colour on every bar - and the way you build that array is the IIf you met in Chapter 8:
upTrend = Close > EMA(Close, 50);

// a colour array: green on uptrend bars, red elsewhere
candleColor = IIf(upTrend, colorGreen, colorRed);
candleColor now holds a colour per bar. Feed it to Plot in the colour slot and every drawing element gets coloured individually.
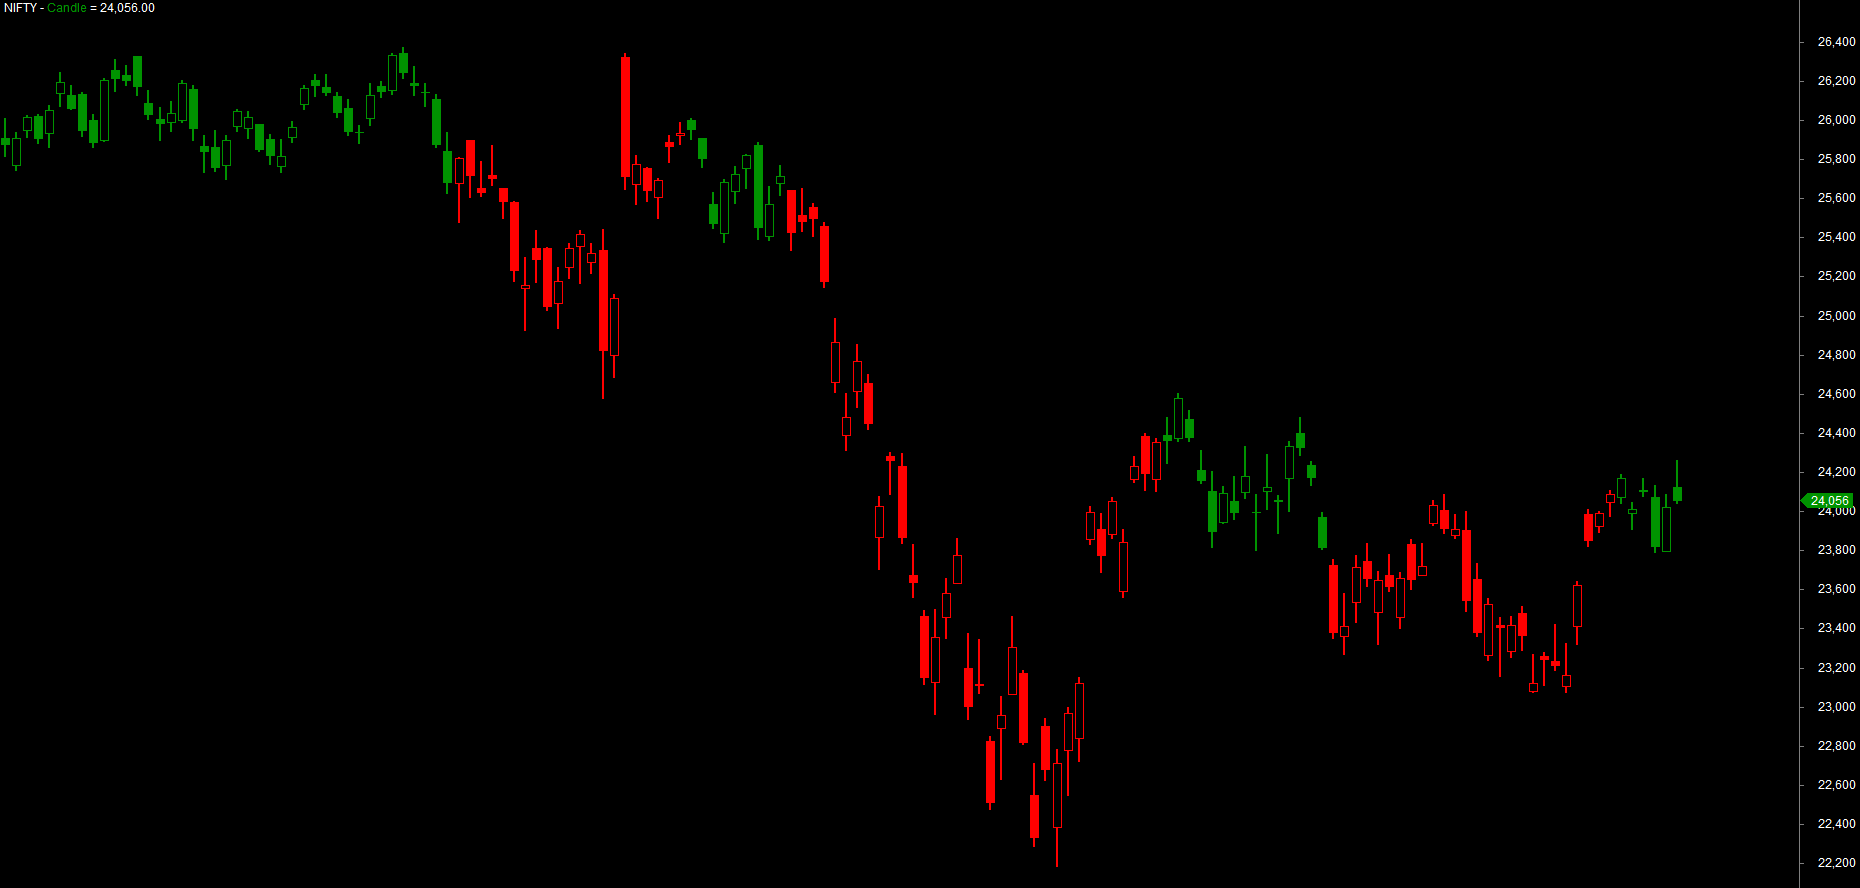
Colouring candles by a rule
Pass that colour array to Plot together with styleCandle and you get candles painted by your rule rather than by simple up/down. Here is the author's MACD example, which colours the candles by whether MACD is above zero:
imacd = MACD(12, 26);

// green when momentum is positive, red when negative
color = IIf(imacd > 0, colorGreen, colorRed);

Plot(Close, "Candle", color, styleCandle);
Suddenly the price candles themselves carry the momentum signal - no separate pane needed. The same trick works for any condition: trend, RSI zone, volume surge. Swap the rule, keep the structure.
The pattern is always the same three steps: build a condition, turn it into a colour array with IIf, then pass that array to Plot as the colour. Master this and you can colour anything - candles, lines, histograms - by any rule you can express.
See the colour decided per bar
It helps to watch the colour get chosen one bar at a time. up is a true/false column, and IIf reads it bar by bar and hands back a colour, so each candle is coloured by its own bar's rule - never by what its neighbours are doing:
| Bar | 1 | 2 | 3 | 4 | 5 |
|---|---|---|---|---|---|
Open |
100 | 102 | 101 | 104 | 103 |
Close |
102 | 101 | 103 | 105 | 102 |
up = Close > Open |
T | F | T | T | F |
IIf(up, colorGreen, colorRed) |
green | red | green | green | red |
Green where the bar closed up, red where it closed down - decided independently on every single bar.
A trend ribbon along the bottom
A ribbon is a thin strip of colour running along the bottom of the chart - a constant visual reminder of state that never crowds the price. You build it by plotting the value 1 (so it fills a fixed-height band) with a special combination of styles:
upTrend = Close > EMA(Close, 50);
ribbonColor = IIf(upTrend, colorGreen, colorRed);

// a full-width strip of colour pinned to the bottom of the pane
Plot(1, "", ribbonColor, styleArea | styleOwnScale | styleNoLabel, 0, 1);
Three style flags do the work, joined with |:
styleAreafills solid down to the axis instead of drawing a line.styleOwnScalegives the ribbon its own private scale so it ignores the price axis and does not squash your candles.styleNoLabelkeeps its value off the y-axis labels.
The trailing 0, 1 set the min and max of that private scale, which pins the strip to a clean band at the bottom. Run it and a green/red bar tracks your trend along the foot of the chart - a glanceable context strip you will want on every layout.
Keep ribbons quiet. One or two strips at the bottom is informative; five competing ribbons is noise. A single trend ribbon plus colour-coded candles usually tells you everything you need without burying the price.
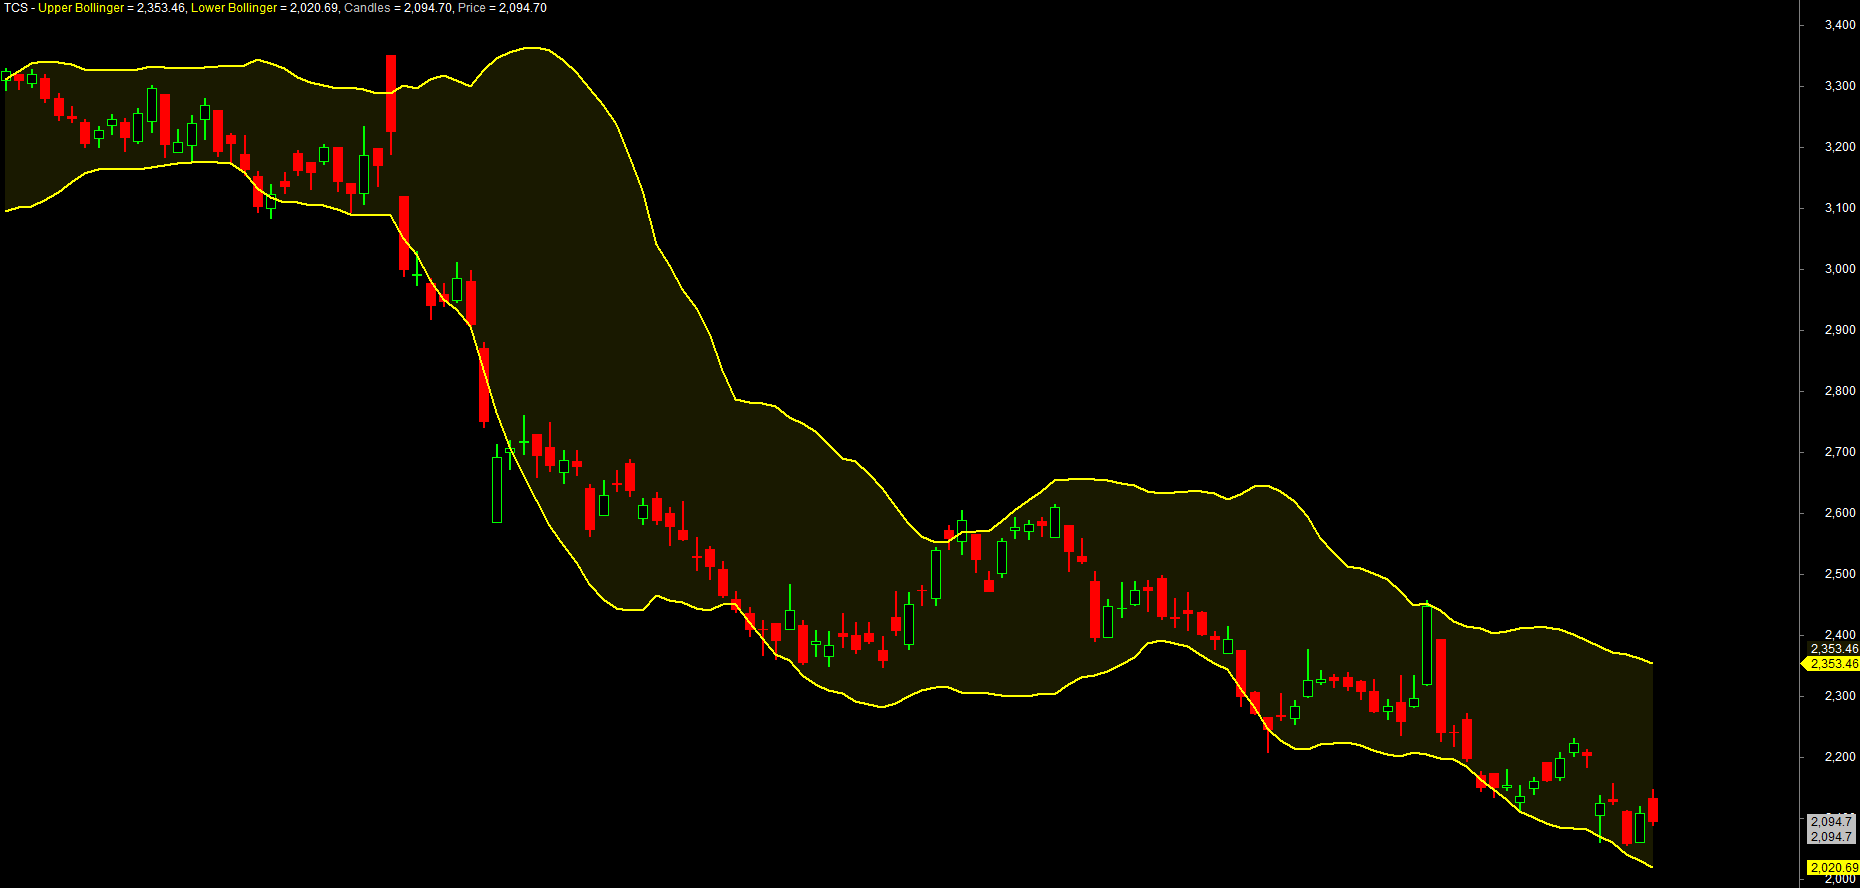
Background shading
Where a ribbon hugs the bottom, background shading tints the whole pane behind the price - ideal for marking a regime like "bullish" or "high volatility." You do it by passing a colour to SetBarFillColor or, more simply, by plotting a tall area in the background. A clean way is a shaded cloud between two levels using PlotOHLC with styleCloud, exactly as the author shades a Bollinger Band:
upper = BBandTop(Close, 20, 2);
lower = BBandBot(Close, 20, 2);

Plot(upper, "Upper Bollinger", colorYellow, styleThick);
Plot(lower, "Lower Bollinger", colorYellow, styleThick);
Plot(Close, "Candles", colorDefault, styleCandle);

// a soft fill between the two bands
fill = ColorBlend(colorYellow, colorBlack, 0.9);   // a faint yellow
PlotOHLC(lower, lower, upper, upper, "", fill, styleCloud);
PlotOHLC here is told to draw a band whose "open/high/low/close" are simply the lower and upper bands, and styleCloud fills the space between them. ColorBlend mixes the bright yellow heavily with black to get a faint tint that shades without hiding the candles underneath.
MACD and RSI colour coding
Indicator panes come alive with the same treatment. Colour a MACD histogram by its sign, or an RSI line by its zone, and the indicator tells its own story:
// MACD coloured by sign, with a zero reference line
imacd = MACD(12, 26);
macdColor = IIf(imacd > 0, colorGreen, colorRed);
Plot(imacd, "MACD", macdColor, styleThick);
Plot(0, "", colorWhite, styleDashed);   // the zero line
// RSI coloured by overbought / oversold / neutral
rsi = RSI(14);
rsiColor = IIf(rsi > 70, colorRed,
           IIf(rsi < 30, colorGreen,
                         colorYellow));
Plot(rsi, "RSI", rsiColor, styleThick);
The nested IIf for RSI is the three-zone pattern from Chapter 8, now doing visible work: red when stretched, green when washed out, yellow in between.
colorXXX constants versus ColorRGB
You have two ways to name a colour. The colorXXX constants - colorGreen, colorRed, colorAqua, colorOrange and dozens more - are quick, readable and cover most needs. When you want a precise shade the constants do not offer, ColorRGB(r, g, b) mixes any colour from red, green and blue components, each from 0 to 255:
myTeal      = ColorRGB(0, 150, 136);    // a custom teal
softGrey    = ColorRGB(60, 60, 60);     // a muted background grey

Plot(Close, "Price", myTeal, styleThick);
ColorBlend(colorA, colorB, fraction), used in the cloud above, is a third handy tool - it mixes two named colours, which is the easy way to get a faded version of a constant for subtle fills.
Prefer the colorXXX constants for everyday work - they make code readable and your intent obvious. Reach for ColorRGB only when you need a specific brand shade or a carefully tuned palette, and consider defining those custom colours once at the top of your formula so they are easy to adjust later.
Try it yourself
- Colour the price candles by whether
Closeis above its 20-EMA, then switch the rule to MACD above zero and compare. - Add a green/red trend ribbon along the bottom using
styleArea | styleOwnScale | styleNoLabel, driven by the same trend condition. - Shade a Bollinger Band cloud with
PlotOHLCandstyleCloud, then lighten or darken the fill by changing theColorBlendfraction. - Build a three-zone RSI colour with nested
IIfand plot it; tweak the 70/30 thresholds and watch the colours shift.
Recap
- A colour can be an array - build it with
IIf(condition, colorA, colorB)and pass it toPlotto colour by a rule. Plot(Close, "", color, styleCandle)paints the candles themselves by any condition - trend, MACD sign, RSI zone.- A trend ribbon is
Plot(1, "", color, styleArea | styleOwnScale | styleNoLabel, 0, 1)- a glanceable strip pinned to the bottom. - Background shading with
PlotOHLC(..., styleCloud)(andColorBlendfor a faint tint) marks regimes without hiding price. - Colour indicator panes - a MACD histogram by sign, an RSI line by zone - so each pane tells its own story.
- Use the readable
colorXXXconstants by default andColorRGB(r,g,b)when you need a precise custom shade.
That closes Module C: you can now make a chart that communicates at a glance. Next we open the Analysis window and put AFL to work across the whole market at once - the world of exploration and scanning.