What is AmiBroker & AFL
The big picture - charts, the Analysis window, and the four things AFL can do: indicate, explore, scan and backtest.
- ·What AmiBroker is for
- ·Indicator vs Exploration vs Backtest
- ·Where AFL code lives
- ·The Formula Editor & Apply
- ·Chart panes & sheets
- ·How this course is structured
If you have ever drawn a moving average on a chart, watched a stock cross it, and wondered "could I get an alert the moment that happens - on every stock I follow?", then you have already arrived at the doorstep of AFL. AmiBroker is the room behind that door, and this course is about making yourself at home in it.
Over the next 35 chapters you will go from "I have never written a formula" to "I have built an indicator, scanned the whole market with it, turned it into a system, backtested it, and wired it up to fire alerts and place orders." We will move one small step at a time, in plain English, and you will not need to be a programmer. If you can read a chart, you can learn AFL.
This first chapter is a tour. We will not write much code yet - we will get the lay of the land, so that when you do start typing in the next chapter, you already know where things live and why.
What is AmiBroker, really?
AmiBroker is a charting and analysis platform built for people who want to do more than just look at charts. Three things make it special for system traders:
- It is fast. It was built around a calculation engine that crunches thousands of bars across hundreds of symbols in a blink. That speed is what makes market-wide scanning and heavy backtesting practical on an ordinary laptop.
- It is programmable. Almost everything you see - every indicator, every signal, every backtest - is described in a small, friendly language called AFL (AmiBroker Formula Language). You write a formula; AmiBroker draws it, scans with it, or trades it.
- It separates data from logic. You point AmiBroker at a data source for prices, and you write AFL for what to do with those prices. The same formula works on any symbol and any timeframe.
This course teaches AFL - the language and the craft of using it well. It assumes you already have AmiBroker installed with some end-of-day or intraday data loaded. If you are still setting that up, follow AmiBroker's own installation and data guides first, then come back here.
Why AmiBroker, and why it is famously fast
There are flashier-looking apps. So why do serious system traders keep coming back to this one? Two reasons: speed, and depth.
Speed is the headline. AmiBroker is written in native C++ - the same kind of low-level, compiled code that powers operating systems - rather than a heavier interpreted stack, and that single choice shows up everywhere. It was the world's first vendor to ship a 64-bit native technical-analysis program for Windows, back in 2006, so it can put all of your RAM to work. Its formula engine was rebuilt to run across every core of your processor at once, so a portfolio backtest spreads itself over your whole CPU instead of plodding through one core. And its charting was re-engineered for up to 40x faster rendering. The practical result is the thing that actually matters to you: you can scan thousands of symbols, or backtest a system across years of data and a basket of stocks, and get your answer in seconds rather than minutes. That fast feedback loop is precisely what lets you iterate on an idea instead of waiting around - and it is why AmiBroker has a reputation as one of the fastest backtesting engines a retail trader can put their hands on.
Depth is the other half. Behind that speed sits a complete research workbench - portfolio-level backtesting, parameter optimisation, walk-forward analysis and Monte Carlo simulation - all driven by the one small language you are here to learn.
A little history. AmiBroker has been around since 1995 - its very first version ran on the Amiga computer, which is where the "Ami" in the name comes from. It is built and maintained by Dr. Tomasz Janeczko, and the AFL language you are about to learn was introduced in 1999 as a dedicated language for building trading systems. You are picking up a tool with a quarter-century of refinement behind it.
The four things AFL can do
Here is the mental model that makes everything else fall into place. The same AFL formula can be used in four different ways, depending on which window you run it in. Beginners often blur these together, so let us separate them clearly right now.
- Indicator - the formula draws something on a chart: a line, coloured candles, arrows, a dashboard. This is the visual, exploratory mode you will spend the early chapters in.
- Exploration - the formula becomes a spreadsheet. For every symbol in a watchlist, it produces a row of numbers - like a screener that lists "all stocks where RSI is below 30 right now".
- Scan - the formula hunts for signals across many symbols and times and reports each one it finds (and can fire alerts).
- Backtest - the formula becomes a trading system. AmiBroker simulates buying and selling by your rules over history and hands you a full performance report.
One formula, four jobs. The difference is not the code - it is where you press the button. A chart "Apply Indicator", or the Analysis window's "Explore", "Scan" or "Backtest". Keep this picture in your head; we devote whole modules to each.
Where AFL lives: the Formula Editor
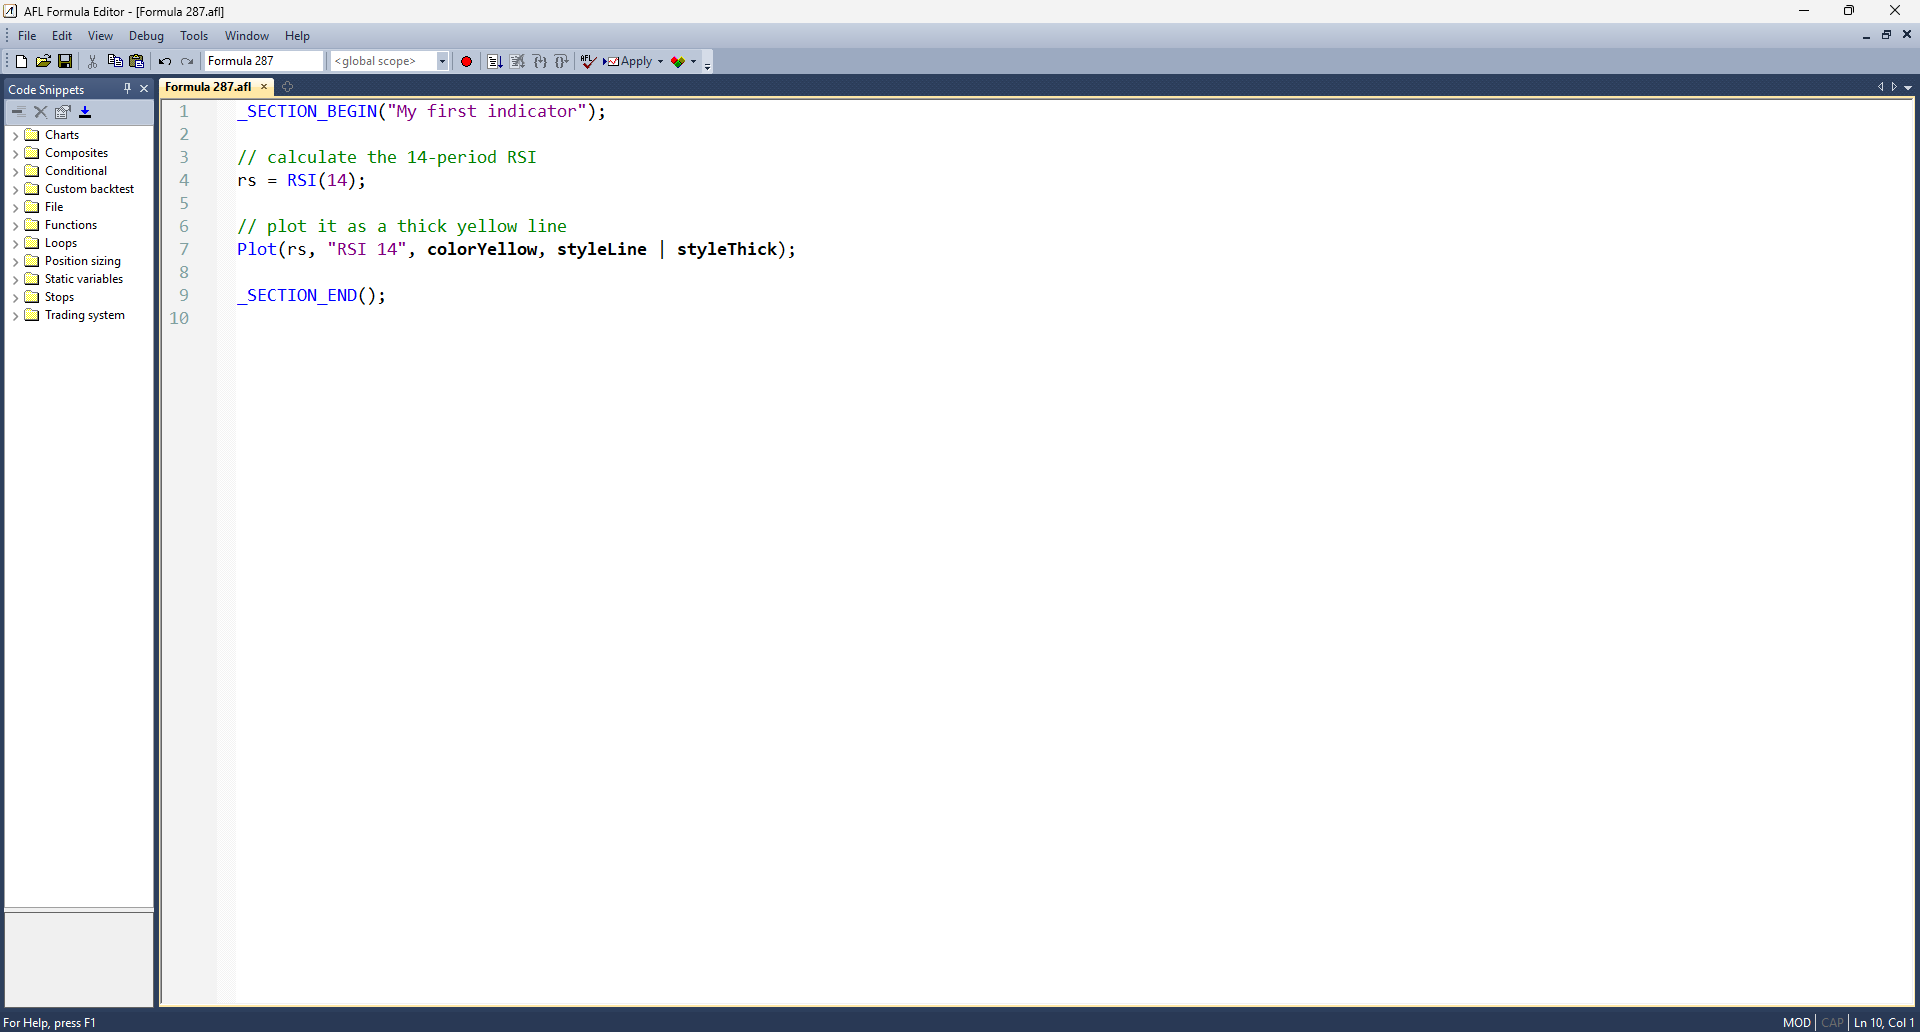
AFL code is written in the Formula Editor - a simple code window with a coloured "syntax highlighting" so keywords, numbers and text stand out. You open it from the AmiBroker menu (Analysis or the toolbar), type your formula, and then either Apply it to the chart you are looking at or run it in the Analysis window.
A formula can be as short as a single meaningful line. Here is a complete, working AFL indicator - it calculates a 14-period RSI and draws it:
_SECTION_BEGIN("My first indicator");

// calculate the 14-period RSI
rs = RSI(14);

// plot it as a thick yellow line
Plot(rs, "RSI 14", colorYellow, styleLine | styleThick);

_SECTION_END();
Do not worry about the details yet - we pull this apart line by line in Chapter 2. For now just notice the shape of AFL: it reads almost like instructions you would give a colleague. "Calculate RSI. Plot it." The _SECTION_BEGIN / _SECTION_END pair is just a labelled wrapper that names this block in the Parameters window; the real work is the two middle lines.
Charts, panes and sheets
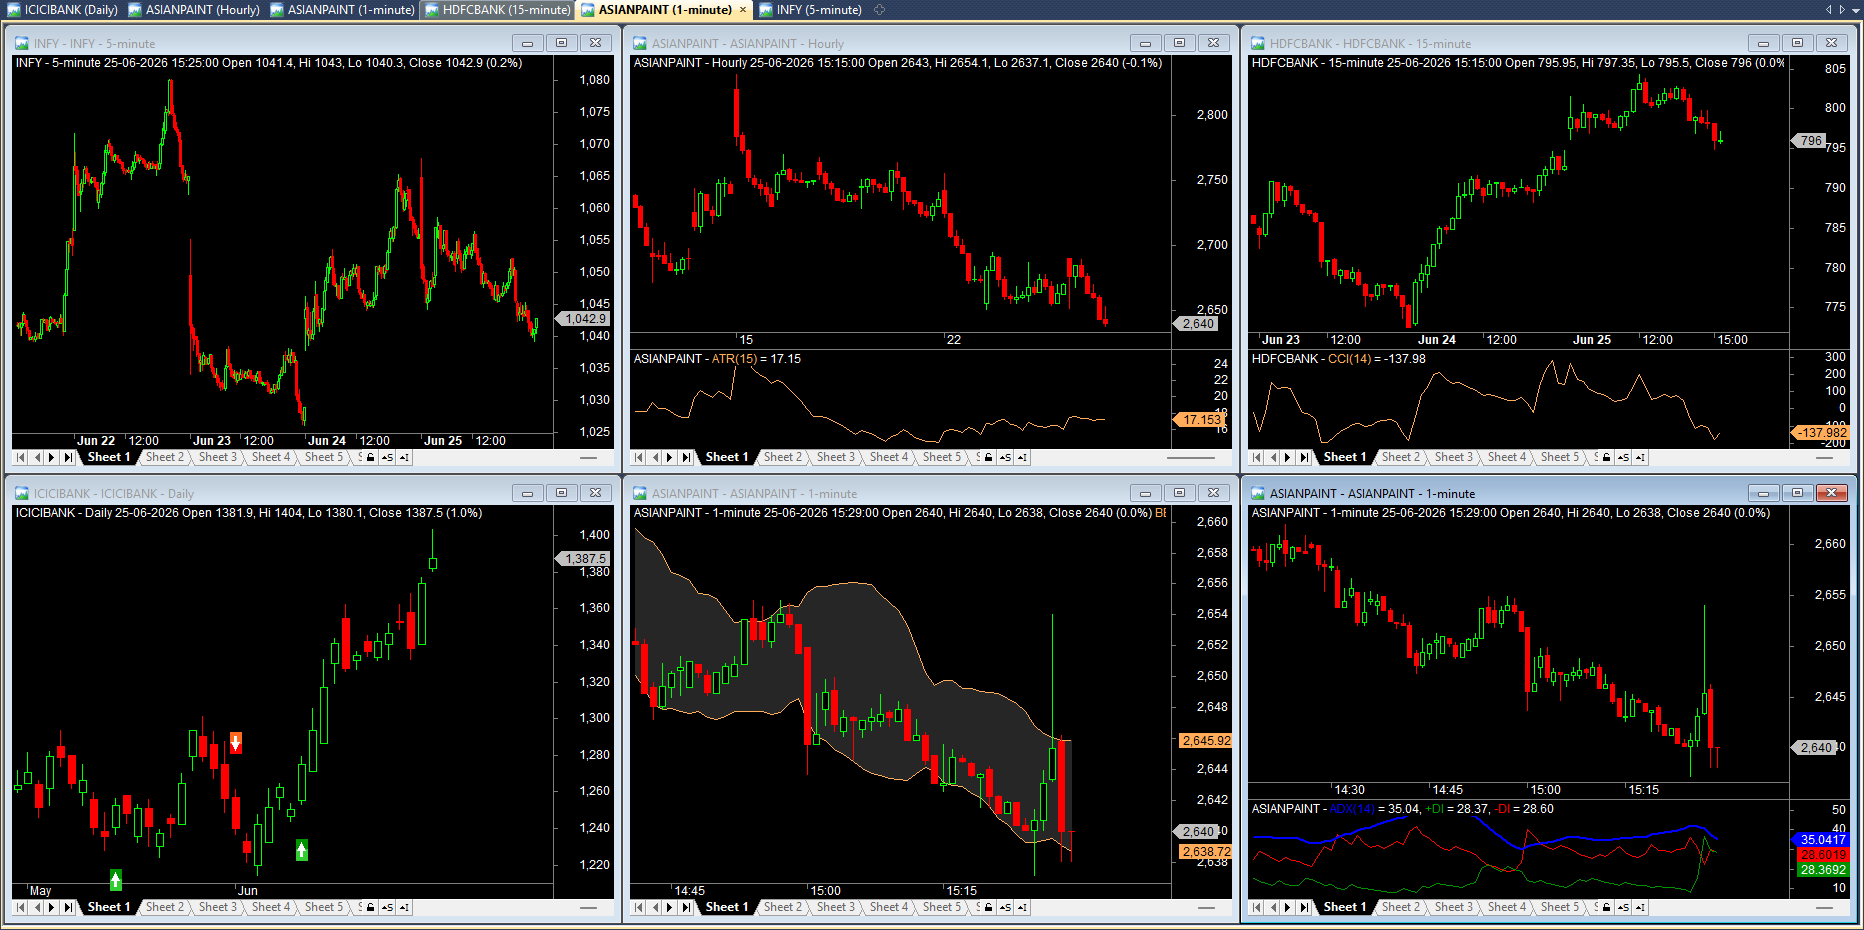
When you apply an indicator, it appears on a chart. A chart is made of stacked panes - the price candles sit in the top pane, and indicators like RSI or MACD usually get their own pane below. You can have several indicators, each in its own pane, lined up under the same price action.
A sheet (or layout) is a saved arrangement of panes - your personal workspace. You might keep one sheet for trend-following with moving averages, and another for momentum with RSI and MACD. AFL is what fills each pane; sheets are how you organise them.
The Analysis window: scanning and backtesting
The other half of AmiBroker is the Analysis window. This is where the same AFL formula stops drawing and starts working across your whole universe of symbols. From here you choose a watchlist, a date range, and press one of: Explore (build the spreadsheet), Scan (hunt signals), Backtest (simulate the system), or Optimize (sweep settings). Modules D, F and the strategy chapters live almost entirely in this window.
A habit worth forming from day one: keep your formulas tidy and named. AmiBroker stores them as .afl files. Make a folder for this course, save each chapter's code with a clear name, and you will build a personal library you actually reuse - instead of re-typing the same EMA crossover for the hundredth time.
How this course is built
We climb a deliberate ladder. Module A (these first chapters) builds the foundation - including the one idea, arrays, that makes AFL suddenly make sense. Module B teaches the language itself. Module C is about making charts that communicate. Module D is scanning the market. Module E turns ideas into systems, Module F backtests and optimises them, Module G is a playbook of five complete strategies you can run, and Module H takes a system live with multiple time frames, alerts and order automation through OpenAlgo.
Throughout, you will see two kinds of pictures. AFL screenshots show you the code and the Formula Editor. Chart and backtest screenshots show you the result. Many of these are placeholders you can fill with your own - the course is designed for you to run the code, capture what you see, and learn by doing.
A standing rule for everything that follows: when you reach the chapters that place real orders (Module H), always practise first in sandbox trading - analyzer mode in OpenAlgo - where orders are simulated and nothing reaches the exchange. Going live should be a deliberate, conscious choice, never an accident. And nothing here is investment advice; it is education.
Try it yourself
Before the next chapter, just get comfortable opening things:
- Open the Formula Editor and look at the coloured code, even if it is empty.
- Open any chart and notice how the price pane and indicator panes stack.
- Find the Analysis window and see the Explore / Scan / Backtest / Optimize buttons - you will be pressing them soon.
Recap
- AmiBroker is a fast, programmable platform; AFL is the small language you write to drive it.
- One AFL formula can do four jobs - Indicator, Exploration, Scan, Backtest - depending on where you run it.
- AFL lives in the Formula Editor; results appear on charts (made of panes, saved as sheets) or in the Analysis window.
- This course is a ladder from your first plotted line to a live, automated system - taught in plain English, with code you can run.
Next, we open the editor for real, write our first indicator from scratch, and learn the editor habits that will save you hours.