Parameters: Interactive Controls
Turn hard-coded numbers into sliders, colour pickers and dropdowns with Param, ParamColor, ParamList and friends.
- ·Param() sliders
- ·ParamColor & ParamStyle
- ·ParamList & ParamToggle
- ·ParamTrigger buttons
- ·Why parameters beat magic numbers
- ·The Parameters window
Every formula so far has hard-coded its numbers. RSI(14), MA(Close, 20), BBandTop(Close, 20, 2) - the periods are baked into the code. That is fine until the moment you want to try 21 instead of 20, because then you must open the editor, find the number, change it, and re-apply. Do that fifty times while tuning an indicator and you will wish for a better way.
Every Param() you add shows up automatically in the Parameters window - and the same control becomes a value the optimiser can sweep the moment you swap Param for Optimize.
The better way is parameters: sliders, colour pickers and dropdowns that live in a dialog beside the chart. Change a parameter and the chart updates instantly - no editing, no re-applying. This chapter turns your static formulas into interactive instruments.
Param: the slider
The workhorse is Param():
length = Param("Length", 20, 1, 100, 1);
Read the five arguments in order:
"Length"- the label shown in the Parameters window20- the default value (what it starts at)1- the minimum the slider allows100- the maximum1- the step, how much each nudge moves it
That single line creates a slider labelled "Length" running from 1 to 100, starting at 20. The variable length then holds whatever the slider is currently set to - and you use it exactly like any number:
length = Param("Length", 20, 1, 100, 1);
Plot(MA(Close, length), "MA", colorYellow, styleThick);
Now the moving-average period is a knob, not a constant. Drag the slider and the line breathes in and out across the candles in real time.
A Param value is read once per redraw and applies to the whole array - it is not a different number on each bar. Think of it as a dial whose current setting feeds your formula, then the formula computes its columns as usual.
Opening the Parameters window
Where do these sliders appear? Right-click the chart and choose Parameters (or press the parameters shortcut). A dialog opens listing every Param in your formula, grouped under the _SECTION_BEGIN names from Chapter 2 - which is exactly why we bother with those section wrappers. Adjust a control and the chart redraws as you move it.
The whole Param family
Param makes numbers, but its relatives handle every other kind of input:
ParamColor("BB Color", colorRed)- a colour picker returning a colour you can pass straight toPlot.ParamStyle("Style")- a dropdown of plot styles (line, histogram, thick...), so the user chooses how it draws.ParamList("Mode", "Fast|Slow|Custom")- a dropdown of text choices separated by|; returns the chosen text.ParamToggle("Show Bands", "Off|On", 1)- a two-way switch; returns0or1, defaulting here to On.ParamStr("Symbol", "NIFTY")- a free text box for typing a string.ParamField("Apply to", 3)- a price-field dropdown (Open, High, Low, Close, Volume...); returns the chosen field as an array.ParamDate("Start date", "01-01-2025")- a date picker; returns a date you compare against each bar's date.ParamTime("Entry after", "09:30:00")- a time picker for intraday; returns a time inTimeNum()format.ParamTrigger("Recalculate")- a push button that returns true once when clicked, for one-off actions.
You met some of these already without naming them: the professional price header in Chapter 5 used ParamColor and ParamStyle so users could recolour and restyle price without touching code.
ParamToggle returns a plain 1 or 0, which makes it perfect for if(...) switches - "if the user turned this on, draw the extra band". ParamList returns the text you selected, which you then compare with == to branch your logic. Pick the control that matches the kind of choice you are offering.
Here is the complete family in one place, with the AmiBroker version each arrived in:
| Function | Creates | Returns | Since |
|---|---|---|---|
Param |
numeric slider | a number | AFL 2.3 |
ParamColor |
colour picker | a colour | AFL 2.3 |
ParamStr |
text box | a string | AFL 2.3 |
ParamDate |
date picker | a date value | AFL 2.60 |
ParamTime |
time picker | a time (TimeNum format) |
AFL 2.60 |
ParamField |
price-field dropdown | a price array | AFL 2.70 |
ParamList |
list-of-choices dropdown | the chosen text | AFL 2.70 |
ParamStyle |
plot-style dropdown | a style flag | AFL 2.70 |
ParamToggle |
Yes/No switch | 0 or 1 |
AFL 2.70 |
ParamTrigger |
trigger button | true once, on click |
AFL 2.70 |
Date, time and field pickers
Three members deserve a closer look, because they unlock things a plain slider cannot.
ParamField lets the user pick which price an indicator runs on - Close by default, but maybe High, or even Volume. It returns the chosen field as an array, so you feed it straight into a function:
price = ParamField("Apply to", 3);          // dropdown: Open/High/Low/Close/Volume...  3 = Close
Plot(EMA(price, 20), "EMA", colorAqua, styleThick);
Now the same formula can smooth the close, the high, or the volume - the viewer decides from the dialog, no editing required.
ParamDate drops a calendar into the Parameters window. It returns a date you compare against each bar's own date, which is perfect for gating logic by a range - an in-sample window, or "highlight everything after the budget":
startDate = ParamDate("Highlight from", "01-01-2025");
inRange   = DateTime() >= startDate;        // true on bars on or after the chosen date
Plot(inRange, "", colorAqua, styleArea | styleOwnScale | styleNoLabel, 0, 1);   // shade the range
ParamTime is its intraday twin - a time-of-day picker that returns the time in the same TimeNum() format you met in the dates-and-sessions chapter, so comparing the two is direct. It is the clean way to expose a session window instead of hard-coding it:
entryAfter = ParamTime("Entry after", "09:30:00");
exitBy     = ParamTime("Square off",  "15:15:00");
tradeOK    = TimeNum() >= entryAfter AND TimeNum() < exitBy;   // only trade inside the window
ParamTime and the new-day logic from the dates chapter are a natural pair: expose your start, end and square-off times as ParamTime controls and an intraday system becomes tunable from the dialog, instead of buried in the code.
Why parameters beat magic numbers
A bare number sitting in code - the 20 in MA(Close, 20) - is what programmers call a magic number: it works, but nobody can tune it without editing and nobody is sure what it means. Parameters fix three problems at once:
- Tune without editing. Drag a slider instead of opening the editor - the fast feedback loop that makes you a better analyst.
- Self-documenting.
Param("Bollinger Length", 20, ...)labels the number, so the next reader (often you) knows what it controls. - Reusable. One parametrised formula replaces a dozen near-identical copies. Instead of
ma20.afl,ma50.afl,ma200.afl, you keep onema.afland set the slider.
A good habit: any number a user might reasonably want to change - a period, a multiplier, a threshold, a colour - should be a Param. Numbers that are part of the maths and must never change (like dividing by 3 for typical price) stay as plain numbers. Parametrise the choices, not the arithmetic.
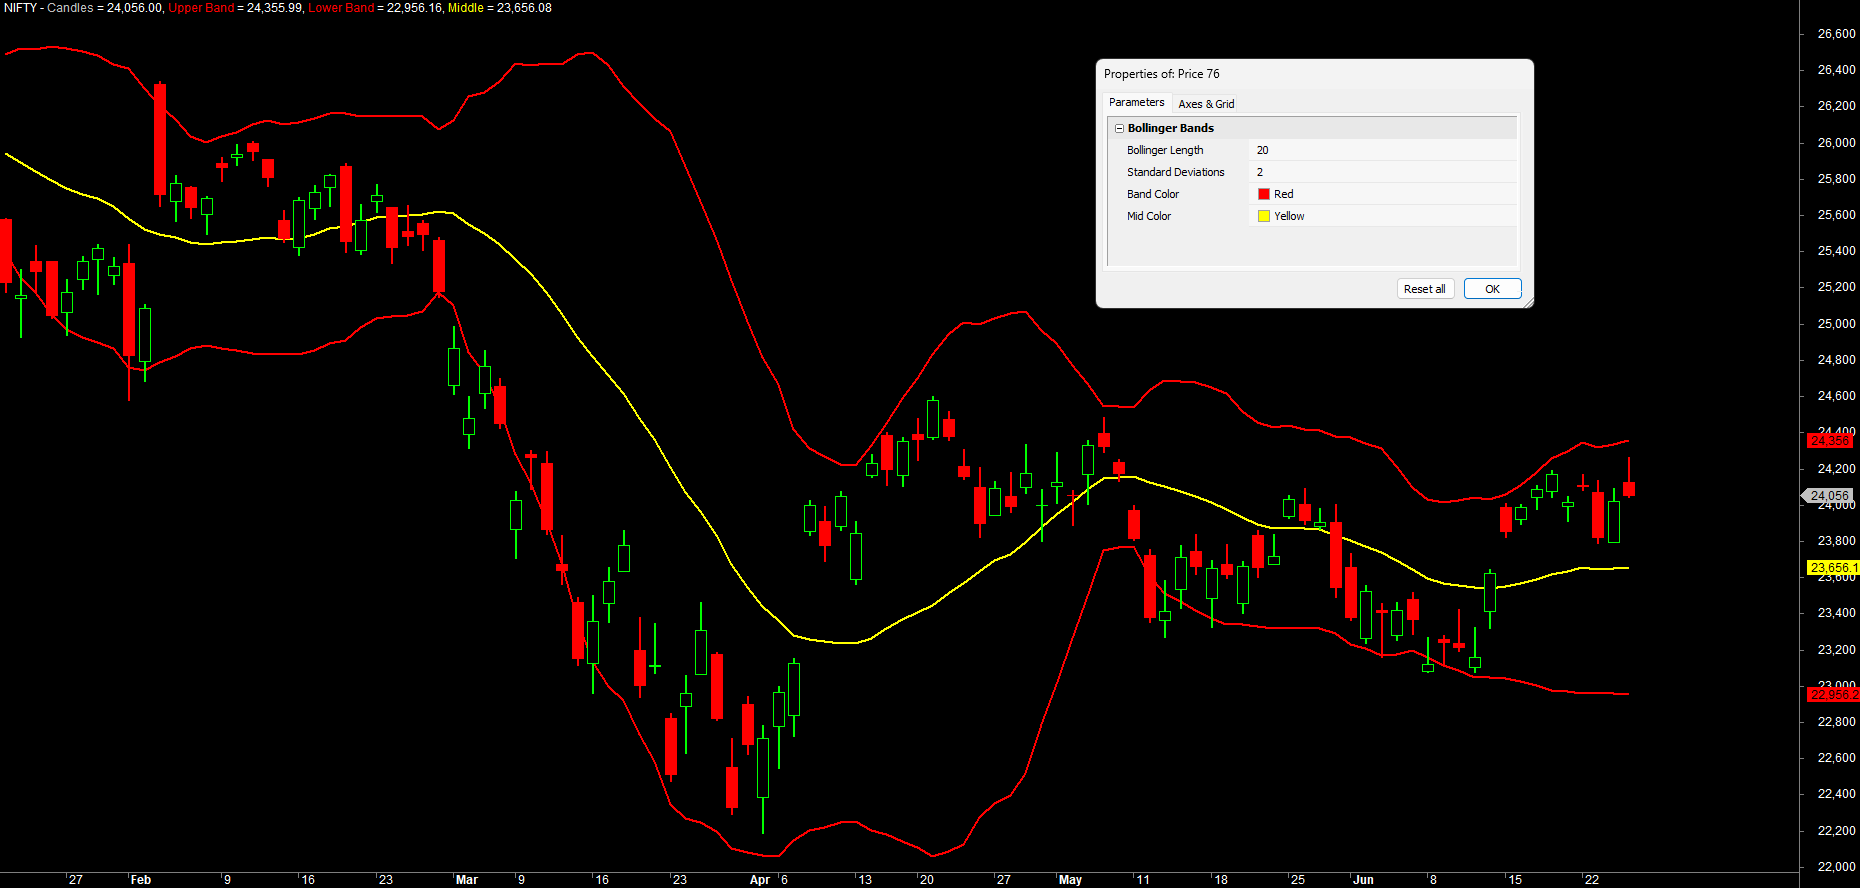
A fully interactive Bollinger Band
Let us bring it together with the author's Bollinger Band with Param Controls.afl, lightly cleaned up. Every choice - the period, the deviation, both colours - is a control. There is not a single magic number left in the drawing logic:
_SECTION_BEGIN("Bollinger Bands");

// --- interactive controls ---
length = Param("Bollinger Length", 20, 1, 100, 1);      // lookback period
dev    = Param("Standard Deviations", 2, 1, 10, 1);     // band width in std devs
bbcolor  = ParamColor("Band Color", colorRed);          // colour of the two bands
midcolor = ParamColor("Mid Color", colorYellow);        // colour of the middle line

// --- Bollinger Band calculation, driven entirely by the controls ---
upper = BBandTop(Close, length, dev);   // upper band
lower = BBandBot(Close, length, dev);   // lower band
mid   = MA(Close, length);              // middle = simple moving average

// --- draw price first, then the bands on top ---
Plot(Close, "Candles", colorDefault, styleCandle);
Plot(upper, "Upper Band", bbcolor, styleThick);
Plot(lower, "Lower Band", bbcolor, styleThick);
Plot(mid,   "Middle",     midcolor, styleThick);

_SECTION_END();
Apply this to NSE INFY or the BANKNIFTY index, open the Parameters window, and you have a Bollinger Band laboratory. Widen dev to 3 and the bands pull away from price; shrink length to 10 and they hug it closely. You are now experimenting at the speed of thought, exactly as a serious analyst should.

A note on ParamTrigger
ParamTrigger is the odd one out - it does not hold a value, it fires an event. It returns true for a single redraw when you click its button, then false again. That makes it ideal for "do this once" actions like sending a test alert or resetting a counter:
if (ParamTrigger("Send test alert"))
{
    // runs once, only on the click - we will use this pattern in the alerts chapter
    _TRACE("Test alert fired");
}
_TRACE writes a line of text to AmiBroker's Log window - the simplest way to confirm a piece of code actually ran. Open it from the main menu with Window -> Log, and your messages appear under the Trace tab; here, each click prints "Test alert fired" there.
_TRACE is your everyday debugging companion. Drop something like _TRACE("got here, length = " + length); wherever you are unsure whether a line runs or what a value holds, then watch the Trace tab of the Log window (Window -> Log). Clear the traces out once the formula behaves.
We will put it to real use in the alerts and automation chapters; for now just know it exists and behaves like a button, not a dial.
Try it yourself
- Add a
ParamToggle("Show Middle Line", "Off|On", 1)and wrap the middle-linePlotinif(...)so the user can hide it. - Add a
ParamList("Average Type", "Simple|Exponential")and use it to switchmidbetweenMAandEMA. - Turn the RSI indicator from Chapter 2 into a parametrised version with a slider for the period and a
ParamColorfor the line. - Open the Parameters window and drag
lengthfrom 5 to 80 on a band formula - watch how the bands tighten and loosen.
Recap
Param(name, default, min, max, step)creates a slider whose current value feeds your formula.- Open controls by right-clicking the chart -> Parameters; they are grouped by
_SECTION_BEGINname. - The family covers every input - ten controls in all:
ParamColor,ParamStr,ParamList,ParamStyle,ParamToggle,ParamField(price field),ParamDate,ParamTime(intraday window), andParamTrigger(button). - Parameters beat magic numbers: tune without editing, self-document the value, and collapse many copies into one reusable formula.
- We built a Bollinger Band driven entirely by controls - a live experimentation lab.
- Parametrise the choices a user might change; keep fixed arithmetic as plain numbers.
Next, we tour the built-in functions you will lean on every day - moving averages, RSI, MACD, ATR, Bollinger Bands and the highest/lowest family - and learn how to read AmiBroker's official function reference.