The Futures Payoff: A Straight Line
Unlike options, a future has the simplest payoff there is, a straight line. Learn to read the long and short futures payoff on a real RELIANCE example, including why the loss can be as large as the gain.
- ·The linear payoff shape
- ·Long futures payoff
- ·Short futures payoff
- ·One-to-one with the underlying
- ·Unlimited profit and loss
- ·Reading a real payoff chart
If you have ever glanced at an options chart, you have seen those bent, hockey-stick shapes that seem to need a degree to read. Futures are a relief by comparison. The picture of how a futures position makes or loses money is the simplest in all of trading: a single straight line tilted at forty-five degrees. There is no bend, no kink, no flat stretch where nothing happens. Whatever the price does, your profit or loss moves with it in a perfectly even, predictable way. This chapter teaches you to read that line, because once you can see it, you understand exactly what a future will do to your account at any price.
A profit-and-loss diagram, usually called a payoff diagram, simply plots where your position stands across a range of prices for the underlying. The horizontal axis is the price of RELIANCE. The vertical axis is your profit above the centre line and your loss below it. For a future, the shape that emerges is a straight diagonal, and that straightness carries a deep meaning.
The straight line and what it means
The defining feature of a future is that its payoff is a straight line. Plot your profit at every possible price of RELIANCE and the dots fall on one unbroken diagonal. This is the most honest payoff in the market, because there is nothing hidden in it. There is no price region where the position behaves differently, no curve that accelerates or stalls. One steady slope, all the way across.
That straightness comes from the nature of the contract. A future is a flat agreement to buy or sell at a fixed price, with no optionality and no premium that decays. So your gain or loss is just the difference between the current price and your entry, multiplied by the lot. A simple difference, multiplied by a constant, always draws a straight line.
A future has the simplest payoff in trading, a straight forty-five degree line. Your profit or loss is just the price move from your entry multiplied by the lot, so it changes at one steady rate no matter where the price goes.
Breakeven sits exactly at your entry
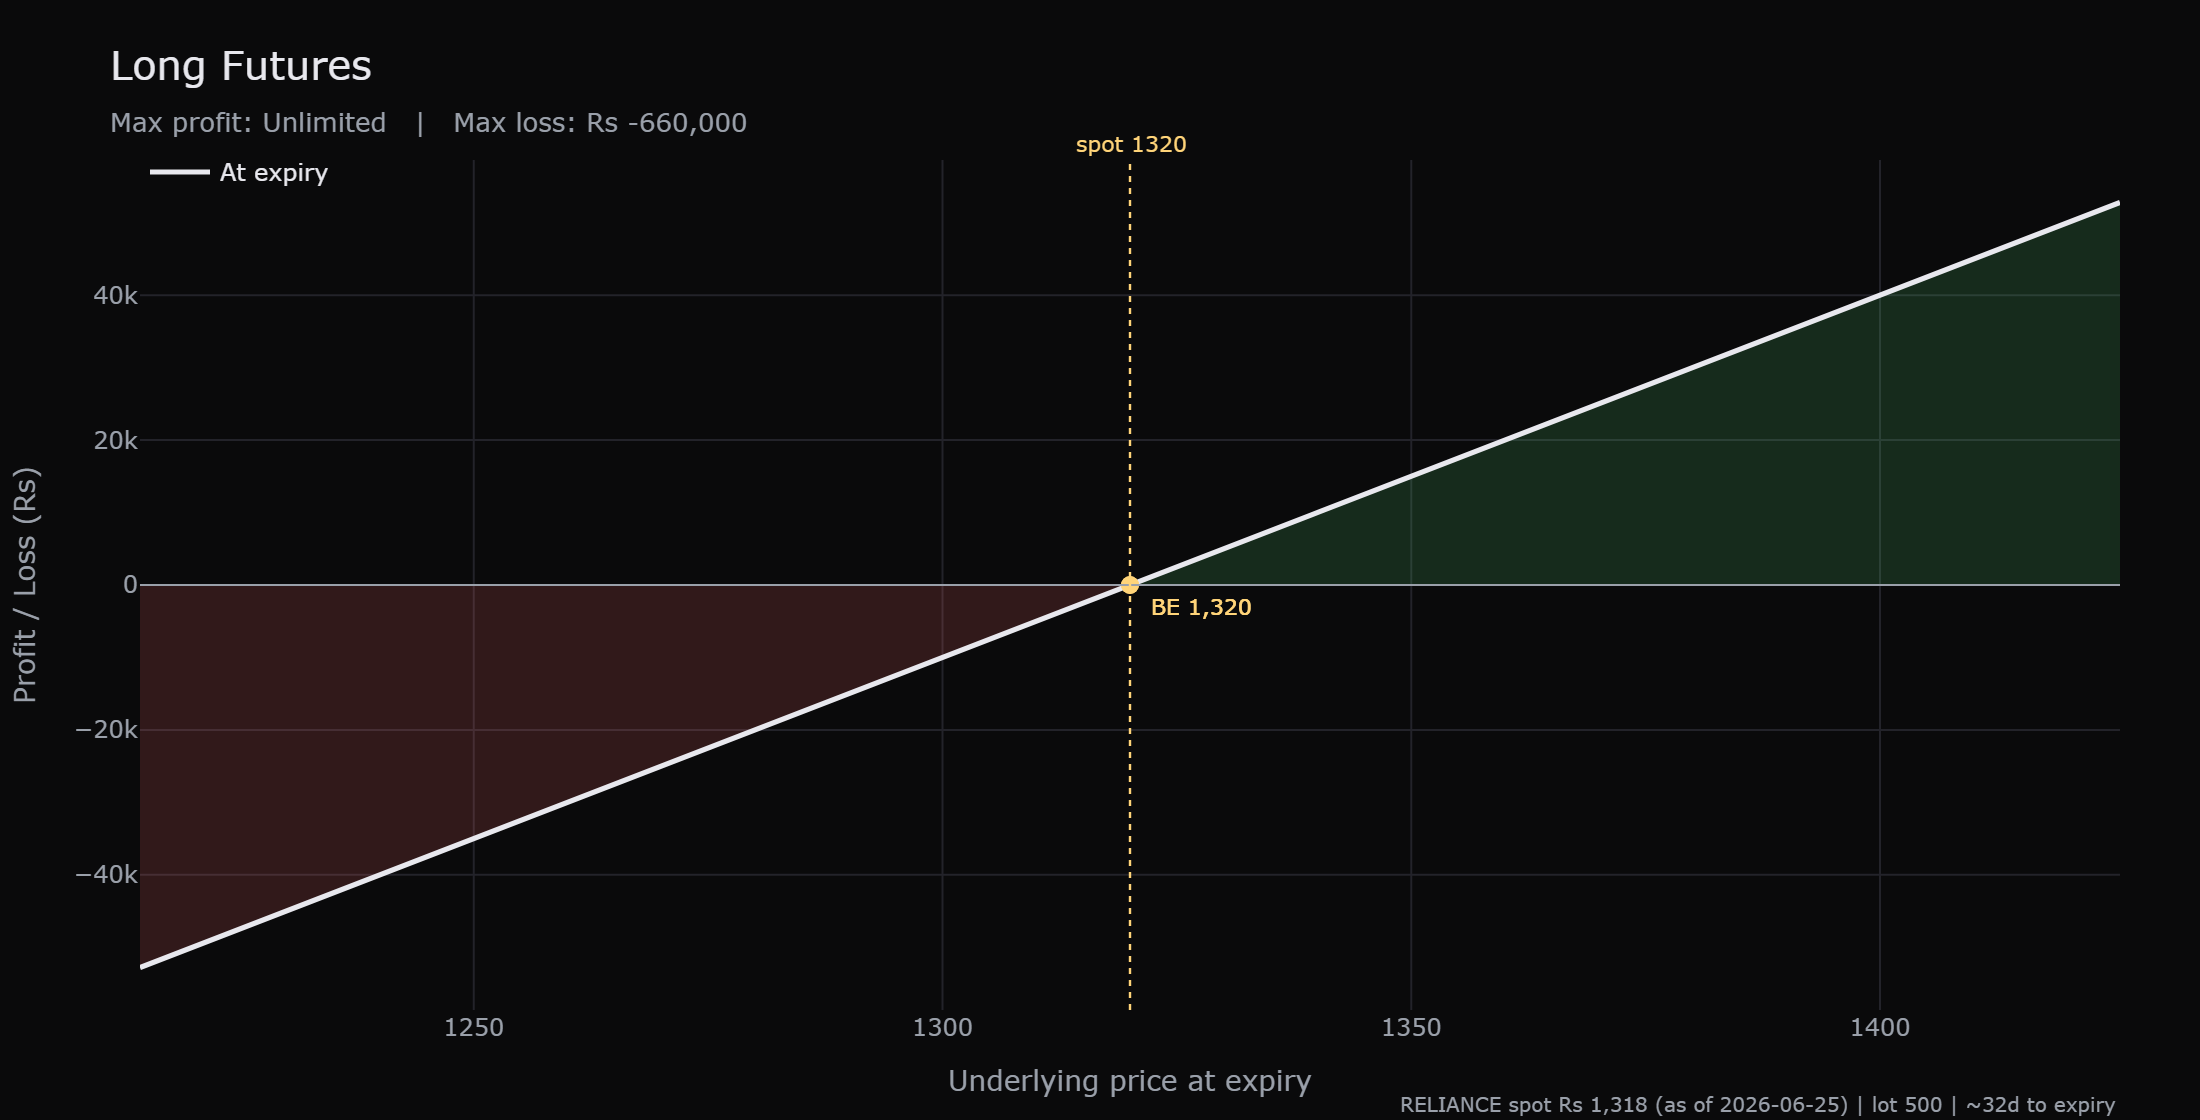
Where does this line cross zero, the point at which you have neither made nor lost anything? For a future the answer is beautifully simple. The breakeven sits exactly at your entry price, which in our running example is 1320.
Think about why. The moment you enter a long future at 1320, you are neither ahead nor behind. If the price stays at 1320, nothing has changed and your profit is zero. Move a single rupee above 1320 and you are in profit. Move a single rupee below and you are in loss. The line passes through zero precisely at the price where you got in.
This is cleaner than options, where you must add or subtract the premium you paid to find breakeven. A future has no premium, so there is no adjustment to make. You broke even the instant you entered, and every tick from there is straightforwardly for you or against you.
- Enter a long future at 1320, and 1320 is your breakeven.
- Above 1320 you are in profit, below 1320 you are in loss.
- There is no premium to recover first, unlike an option.
One-to-one with the underlying
The slope of the line tells you how fast your money moves, and for a future that slope is one-to-one with the underlying. Every one rupee move in RELIANCE produces a fixed, equal change in your position. There is no leverage hidden inside the slope itself and no dampening. The future tracks the stock rupee for rupee.
Put the lot size on top of that and the rupee figure appears. The RELIANCE lot is 500 shares, so one rupee of movement in the stock is Rs 500 to your position. If RELIANCE rises 10 rupees, a long lot gains 10 times 500, which is Rs 5,000. If it falls 10 rupees, that same long lot loses Rs 5,000. The relationship is symmetric and constant. The same Rs 500 per rupee applies whether the price is at 1280 or at 1380.
| Move in RELIANCE | Change for one long lot (500 shares) |
|---|---|
| Up 1 rupee | plus Rs 500 |
| Up 20 rupees | plus Rs 10,000 |
| Down 1 rupee | minus Rs 500 |
| Down 20 rupees | minus Rs 10,000 |
RELIANCE moves from 1320 to 1340, a 20 point rise. A long lot of 500 shares gains 20 times 500, which is Rs 10,000. Had it fallen 20 points to 1300 instead, the same lot would have lost exactly Rs 10,000. The slope is the same in both directions.
The short payoff is the same line, mirrored
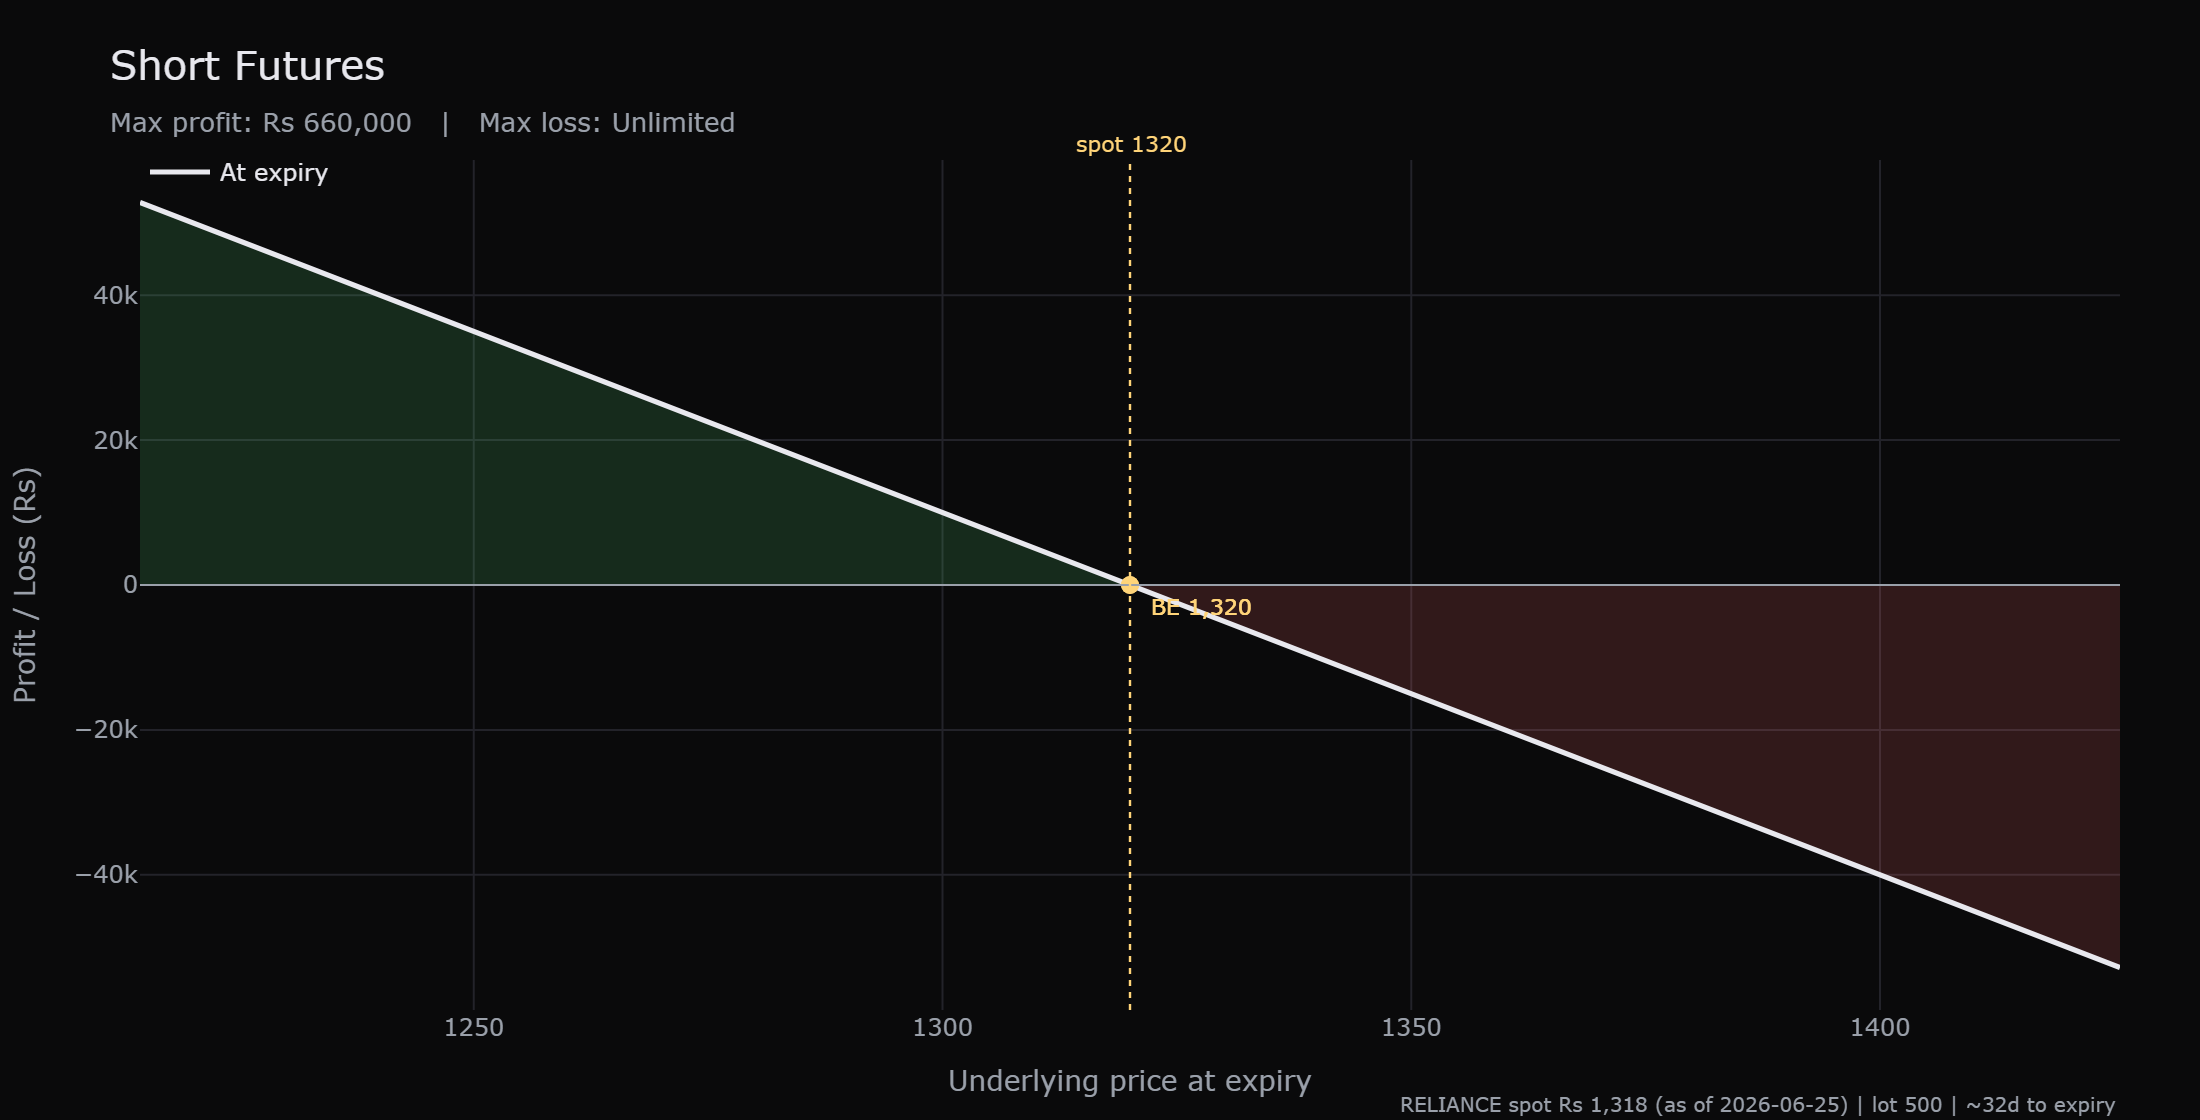
Everything above describes a long position, where the line rises from lower left to upper right. A short position simply flips that picture. Its payoff is the same straight line, but sloping the other way, falling from upper left to lower right. A short profits when the price falls and loses when it rises, the exact mirror of the long.
The numbers are identical, only reversed. Breakeven for a short entered at 1320 is still 1320. The slope is still one-to-one, still Rs 500 per rupee on a lot of 500. The only difference is the sign. A 20 point fall that costs a long Rs 10,000 hands a short Rs 10,000, and a 20 point rise does the opposite.
Place the two diagrams side by side and you see the whole truth of futures in one glance. Two straight lines crossing at 1320, one rising and one falling, perfect reflections of each other. Whatever one side gains, the other side loses, rupee for rupee. That is why for every long there is a short, and why the futures market is a clean transfer of money between the two.
Both profit and loss are effectively unlimited
Here is the part that demands respect. Because the line is straight and never flattens, a future offers no built-in protection in either direction. Both the profit and the loss are effectively unlimited.
On a long position, the line keeps rising as long as the price rises, and there is no natural ceiling on a stock price, so the profit has no fixed cap. But the loss runs almost as far. The line keeps falling as the price falls, all the way down until the stock would reach zero. For our RELIANCE long entered at 1320, the worst case is the stock going to zero, a fall of 1320 points. Multiply by the lot of 500 and the maximum loss is about Rs 6,60,000 per lot. That is the only floor under the loss, and it is a long way down.
For a short the danger is even starker. A short profits as the price falls, capped only by the stock reaching zero, again about Rs 6,60,000. But its loss comes from the price rising, and a price can rise without any limit at all. The loss on an unhedged short has no theoretical ceiling.
- A long future profits without a fixed cap as the price rises.
- A long future loses down to the stock reaching zero, about Rs 6,60,000 per lot here.
- A short future profits down to zero, about Rs 6,60,000, and loses without a fixed ceiling as the price rises.
A straight payoff means a future never stops losing on its own. There is no level where the damage caps out except the stock reaching zero, about Rs 6,60,000 on one RELIANCE lot, and on a short the loss has no ceiling at all. The only real protection is a stop that you set and the size of the position you choose.
Why this matters before you meet options
The straight line is worth sitting with, because the next instruments you study will look nothing like it. An option payoff is bent. It flattens out on one side, so an option buyer can lose only the premium paid, no matter how far the market moves the wrong way. That kink is exactly what makes options feel safer to a buyer and exactly what makes them more complicated to price and trade.
A future has no such kink. Its symmetry is its honesty. You take the full move in your favour and the full move against you, with nothing softened. There is no premium to lose, no decay working against you, and no curve to puzzle over. What you see on the chart is precisely what you get in your account.
Before you trade a future, draw or picture its straight payoff with your real entry and lot marked on it. Knowing your breakeven and the rupees per point at a glance is the simplest discipline in futures, and the one most beginners skip.
The futures payoff is a single straight line. Breakeven sits at your entry of 1320, the slope is one-to-one at Rs 500 per rupee on the lot, and the line runs in both directions with profit and loss both effectively unlimited, the loss floored only by the stock reaching zero near Rs 6,60,000. Hold that picture in your head and you will always know exactly where a future stands.