Open Interest in Futures
Open interest is the most quoted and most misread number in futures. Learn what OI actually means, how to read a long or short build-up versus an unwinding or covering, volume versus OI, and why OI is not a guaranteed prediction signal.
- ·What open interest means
- ·Long build-up and short build-up
- ·Long unwinding and short covering
- ·Volume vs open interest
- ·OI with price together
- ·Why OI is not a sure signal
Two traders watch the same RELIANCE future climb from Rs 1,318 toward Rs 1,340 and reach opposite conclusions. One sees a healthy rally worth joining. The other sees a tired bounce worth fading. They are looking at the same price, so what is the second trader seeing that the first is missing? Very often the answer is open interest, a number that sits quietly next to price and volume on every futures screen and tells you something neither of the others can. Price tells you where the contract trades. Volume tells you how busy the session was. Open interest tells you how many bets are still on the table, and whether the crowd is building a position or quietly heading for the exit.
Once you learn to read it, open interest turns a flat price chart into a story about commitment. It will not tell you what to buy. It will tell you how much conviction is behind the move you are already watching, and that is a different and very useful thing.
What open interest actually counts
Open interest, usually shortened to OI, is the number of futures contracts that are currently open and have not yet been closed out. It counts each contract once. A single contract has a buyer on one side and a seller on the other, and the two of them together make one unit of open interest, not two. So when you read that the RELIANCE July future has an open interest of, say, forty thousand contracts, it means forty thousand live agreements are still standing between buyers and sellers who have not yet squared off.
The key word is open. The moment both sides of a contract close their positions, that contract vanishes from the count. Open interest is therefore a running tally of unfinished business, a snapshot of how many futures bets are live at this instant.
Open interest is the number of futures contracts still open and not yet closed, counting each contract once. It measures how many positions are currently alive in the market, not how many trades happened.
Open interest is not volume
Beginners constantly confuse open interest with volume, and the two answer completely different questions.
Volume counts how many contracts changed hands during the day. Every time a contract trades, it adds to the day's volume, whether that trade opened a new position or closed an old one. Volume is a measure of activity, of how busy the session was.
Open interest counts how many positions remain open after all that activity. It is a measure of commitment, of how much is still riding.
The cleanest way to remember the difference is what happens overnight. Volume resets to zero at the start of every session, because it only ever counts that one day's trading. Open interest does not reset. It carries forward and accumulates, rising and falling as positions are opened and closed over the whole life of the contract. A busy day can have huge volume yet leave open interest unchanged, if every new buyer was simply matched by someone closing an old position. A quiet day can have modest volume yet swell open interest, if most of that trading was fresh money entering.
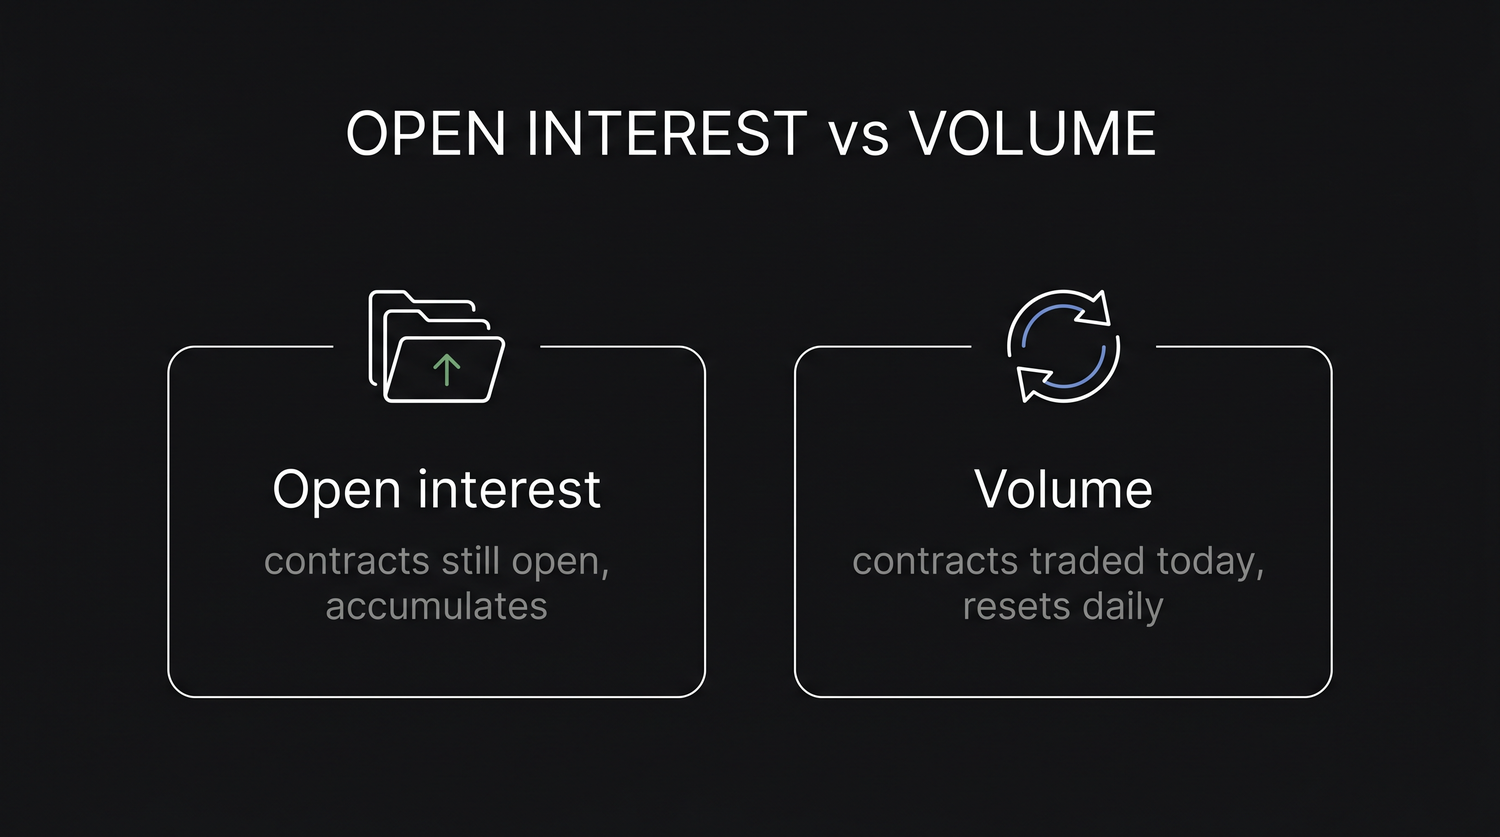
Volume is a daily measure that resets every morning. Open interest is a running total that accumulates across days. One tells you how busy today was; the other tells you how much is still at stake.
How open interest rises and falls
Open interest changes only when a contract is genuinely created or destroyed, and that depends on who is trading with whom.
When a new buyer meets a new seller, a brand new contract is created. Neither of them had a position before, and now there is a fresh agreement between them. Open interest rises by one. Real money has committed to the market.
When a holder who is long sells to a holder who is short and both are closing, that contract is extinguished. The agreement they each held is settled and gone. Open interest falls by one. Money has left the market.
In between, open interest can also stay flat. If a new buyer takes over the position of an old buyer who is exiting, the contract simply changes hands. One position closes, one opens, the total is unchanged. So rising open interest means new positions are being built and fresh money is flowing in, while falling open interest means positions are being closed and money is flowing out. That single distinction is the engine behind everything that follows.
Imagine the RELIANCE future trades and open interest climbs by two hundred contracts in an hour. That tells you two hundred genuinely new agreements were created, lot size 500 each, so fresh exposure to roughly one lakh shares of RELIANCE was just put on by traders who were not in before.
The price-and-open-interest table
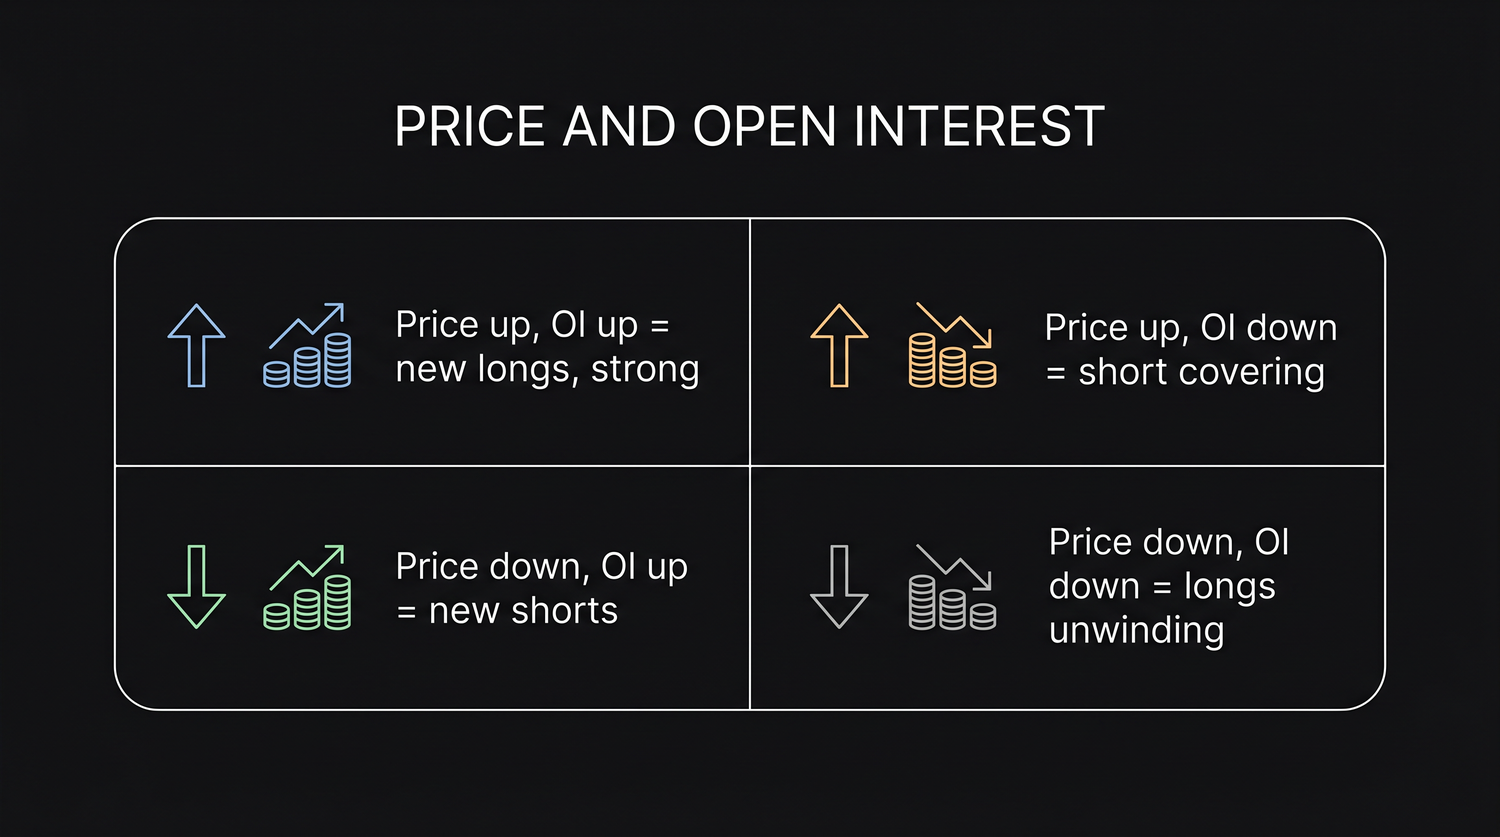
Here is where open interest earns its keep. By pairing the direction of price with the direction of open interest, you can read what kind of money is driving a move. There are four combinations, and they are worth learning by heart.
| Price | Open interest | What it usually means | Strength of the move |
|---|---|---|---|
| Up | Up | Fresh longs entering, new buyers committing | Strong, well supported trend |
| Up | Down | Short covering, shorts buying back to close | Weak, a rally on closing not on new buying |
| Down | Up | Fresh shorts building, new sellers committing | Strong downtrend with conviction |
| Down | Down | Longs unwinding, old buyers giving up | Weak, a fall on exit not on new selling |
Read each row as a small story.
Price up with open interest up is the healthiest kind of rally. New buyers are entering and creating fresh contracts, so the rise is backed by genuine new commitment. The trend has fuel behind it.
Price up with open interest down looks similar on the price chart but is a different animal. Here the price is rising while open interest shrinks, which means the buying is coming mostly from shorts buying back to close their losing positions. This is short covering, a rally driven by people closing rather than fresh buyers committing. Once the trapped shorts have finished covering, the fuel runs out, so this kind of rise is weaker than it looks.
Price down with open interest up is the mirror of the first row. The price is falling and open interest is growing, which means new sellers are stepping in and building fresh short positions. The decline has real conviction behind it, not just nervous selling.
Price down with open interest down is a fall driven by longs unwinding, old buyers throwing in the towel and closing out. Once the tired longs have finished selling, the selling pressure can dry up, so this decline is weaker than a fall on rising open interest.
When a rally is led by short covering, open interest falls even as price rises. That is your clue the move may be running on borrowed time, because nobody fresh is buying, the shorts are merely escaping.
Open interest and the rollover week
There is one moment in every contract's life when open interest tells an especially clear story, and that is the rollover week before expiry. As the near month approaches its final Tuesday, traders who want to keep their view alive close their near-month positions and reopen the same exposure in the next month. You met this as rolling over in an earlier chapter.
On the open interest screen this shows up plainly. The near month open interest falls as positions are closed, and at the same time the next month open interest rises as those positions are rebuilt one month forward. You are literally watching the centre of gravity of the market shift from one contract to the next. When the next month's open interest overtakes the near month's, the cycle has effectively turned, and the action has moved on.
This is a real signal, not a curiosity. A heavy shift of open interest into the next month tells you traders are committed enough to pay the carry and stay in for another month. A weak shift, where positions are closed but not rebuilt, hints the crowd is stepping aside rather than renewing its view. Watching where open interest sits across the months keeps you trading the contract that holds the real liquidity and tells you how the cycle is turning.
During rollover week you can watch open interest drain out of the expiring month and pool into the next one. The day the next month carries more open interest than the near month is the day the market has, in practice, moved its attention forward.
Open interest confirms, it does not command
Now the honest part. Open interest is a powerful lens, but it is not a buy button. On its own it never tells you to enter or exit. What it does is confirm the story that price is already telling, by revealing whether real commitment stands behind a move or whether the move is just old positions being closed.
Used that way it is genuinely valuable. If NIFTY, with its lot of 65 near 24,000, is grinding higher and open interest is climbing with it, you have evidence the uptrend has fresh believers and is better supported. If the same NIFTY is climbing while open interest falls, you know to treat the rally with suspicion, because it is running on short covering rather than new buying. The price gives you the direction. Open interest gives you the conviction reading behind it.
But open interest can mislead if you lean on it alone. The same number can fit more than one story, the data you see is usually end-of-day rather than instant, and a single day's change can be noise. Treat open interest as one honest witness among several, alongside price, volume, and the basis, never as a lone oracle.
Open interest is a confirming signal, never a standalone buy or sell trigger. It tells you whether a move has real commitment behind it. It does not tell you to act. Pair it with price and your own plan, and never trade on an open interest reading by itself.
The lasting lesson is simple. Price shows you where the future trades and volume shows you how busy the day was, but open interest shows you how much conviction is still in the market and which way fresh money is leaning. Learn the four rows of the price-and-open-interest table, watch the count shift between months at rollover, and use what you see to judge the strength of a trend you are already studying. Read that way, open interest will not hand you a trade, but it will keep you honest about how much belief is really behind the moves you are tempted to chase.