From Setup to System: Build & Backtest
Combine trend, a level and a trigger into a rule-based setup, then test it honestly on real history. Learn how a simple, well-tested edge beats a complicated guess, and how to measure it.
- ·Turning analysis into rules
- ·Entry, exit and stop in advance
- ·What backtesting really shows
- ·Win rate vs reward-to-risk
- ·Avoiding curve-fitting
- ·From idea to a tested setup
A trading plan should be a sentence you could hand to a stranger, so clear that they would take the exact same trades you would. "Buy this stock when it looks strong" is not a plan, it is a feeling. "Buy when today's closing price is above the average price of the last 200 days, and the average of the last 50 days is above the average of the last 200, then sell when that stops being true" is a plan, because there is nothing left to argue about. Every word is measurable, and every decision is made ahead of time.
Turning a chart read into rules like that is what separates a hobby from a process. But writing the rules is the easy half. The hard, humbling half is testing them honestly against real history, and being willing to hear that your clever idea barely beats doing nothing at all. This chapter builds one simple rule-based plan, runs it across 48 real stocks, and reads the uncomfortable truth in the results.
From a hunch to a rule
A complete trading plan answers four questions, with no exceptions:
- Context: when am I even allowed to consider this trade? (the trend, the timeframe, the overall mood of the market)
- Trigger: what exact event puts me in? (a crossing of two lines, a break above a level, a turn off a floor)
- Exit: what takes me out when I am right, and when I am wrong? (a target, a trailing rule, a stop)
- Size: how much do I commit? (the next chapter's job)
If even one of these is vague, you do not have a system, you have a story you will rewrite mid-trade to feel better. The discipline is to pin all four down before a single rupee is at risk, so that in the heat of a live trade there is nothing to decide, only a rule to follow.
Our example plan is deliberately plain, a classic buy-only trend filter. A trend filter is just a rule that only lets you hold the stock while the broader trend is up, and parks you safely in cash the rest of the time.
The rule: hold the stock whenever today's close is above its 200-day average and the 50-day average is above the 200-day; otherwise, sit in cash. A moving average, remember, is simply the average price over the last so-many days, redrawn each day to smooth out the noise. This is about as simple as a system gets, one trend filter, no targets, no cleverness. That simplicity is the point, because a simple rule is something we can actually trust the test on.
A real plan is a rule a stranger could follow and land on the same trades. If your "system" needs you standing there to interpret it, it is not testable, not repeatable, and not really a system. It is just guesswork in a costume.
Decide entry, exit and stop before you click
Notice that our rule defines the exit in the same breath as the entry. That is not optional. The single most common way traders turn a winning idea into a losing account is by entering on a rule and exiting on an emotion, grabbing profits early out of fear, or clinging to losers forever out of hope.
Three things must be fixed in advance:
- Entry: the exact condition that puts you in. ("Both averages line up and price closes above the 200-day.")
- Exit when right: what banks the win. A target, a trailing stop (a line that follows price up to lock in gains), or simply "stay until the trend rule breaks."
- Exit when wrong: the stop. The price or condition that admits the trade has failed and gets you out while the loss is still small. (We size and place this properly in the next chapter.)
Our trend filter folds the stop into the rule itself: the day the conditions stop being true, you are out. Crude, but defined. The virtue is that you never have to decide anything during the trade. The decision was made when you were calm.
What a backtest actually shows
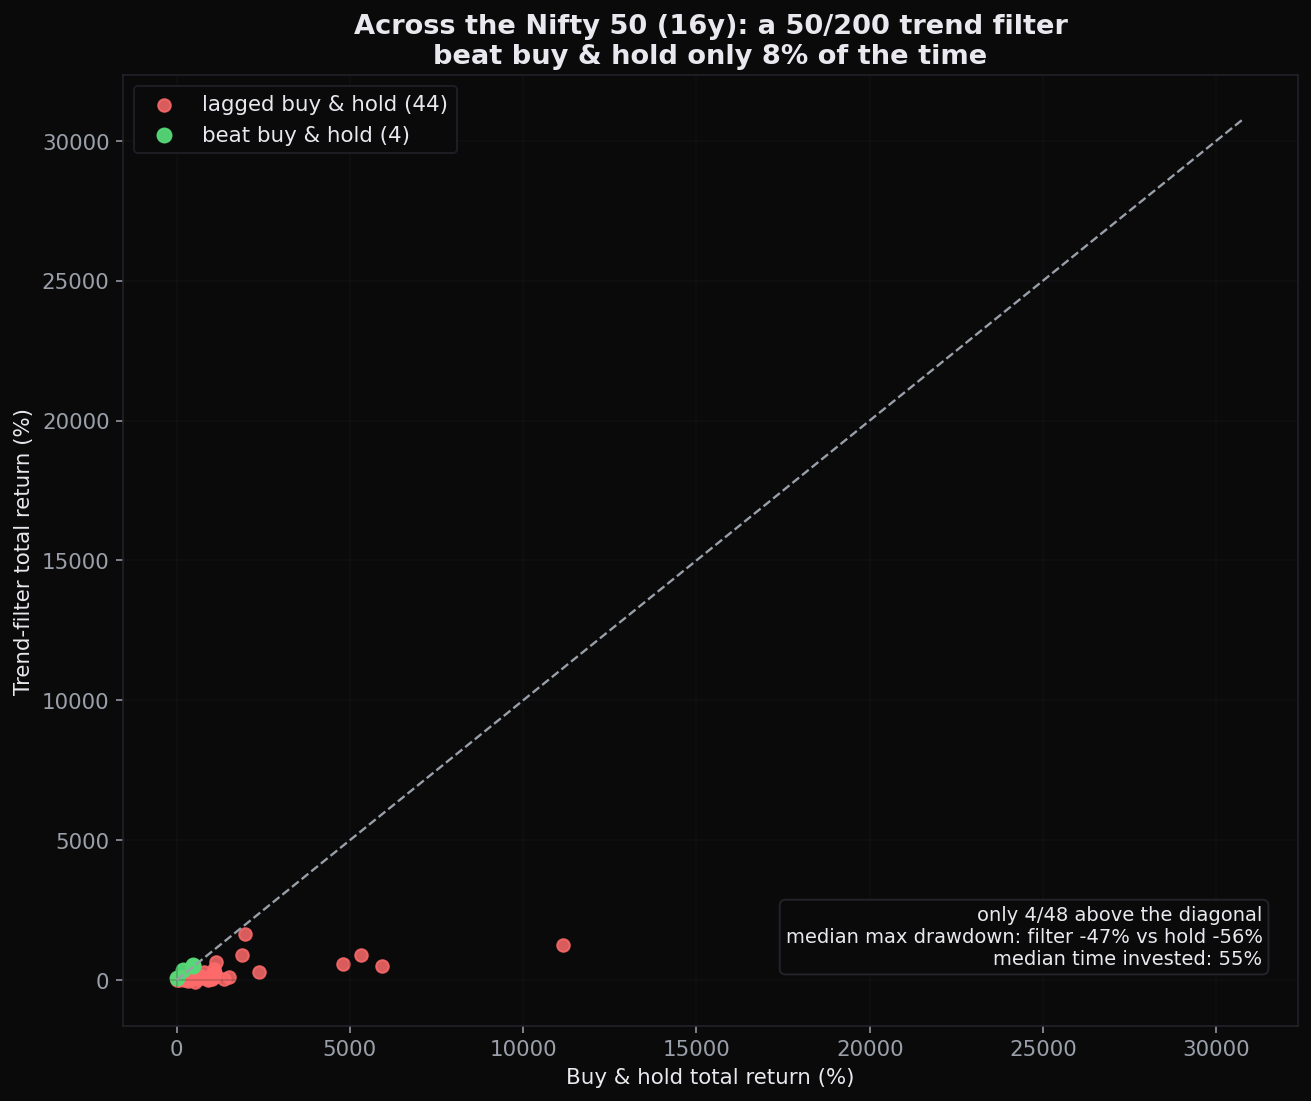
A backtest replays your rule over historical data and reports what it would have done. It is the closest thing chart analysis has to a laboratory, and it is where most beautiful ideas quietly go to die. We ran our trend filter across 48 Nifty stocks over 16 years and compared it to the simplest possible alternative: buy the stock and just hold it, which traders call buy-and-hold.
The result is a masterclass in honesty.
Read those numbers slowly:
- The trend filter beat buy-and-hold in only 4 of 48 stocks, about 8% of the time.
- The middle, or median, total return was +107% for the filter versus +744% for just holding. Holding won, and not by a little.
- But the filter's median worst drop from a peak was −47% versus −56% for holding, a shallower worst-case fall.
- And it was invested only about 55% of the time, sitting safely in cash for the other 45%.
So the honest verdict on our clean, sensible, widely taught trend filter is this: it mostly underperformed simply holding the stock, while giving a somewhat smoother ride and far less time exposed to the market. It is not a money machine. It traded away a large slice of return in exchange for a smaller drop and more peace of mind. Whether that is a good deal depends entirely on what you value, but anyone who sold you this rule as a path to riches was not looking at the data.
This is the recurring lesson of the whole course, now measured end to end: a golden cross, a popular "buy" signal where a faster average crosses above a slower one, was positive only 59% of the time at 60 days; MACD crosses beat a +5% gain only 37% of the time; and now a full trend-filter test underperforms simply holding 92% of the time. The edge in trading was never in the signal. It is in risk control and discipline.
Reading the equity curve
The single most useful output of a backtest is the equity curve, the running value of your account plotted over time. It shows not just how much you made but how you made it: the smooth stretches, the violent drops, and the long flat periods of doing nothing.
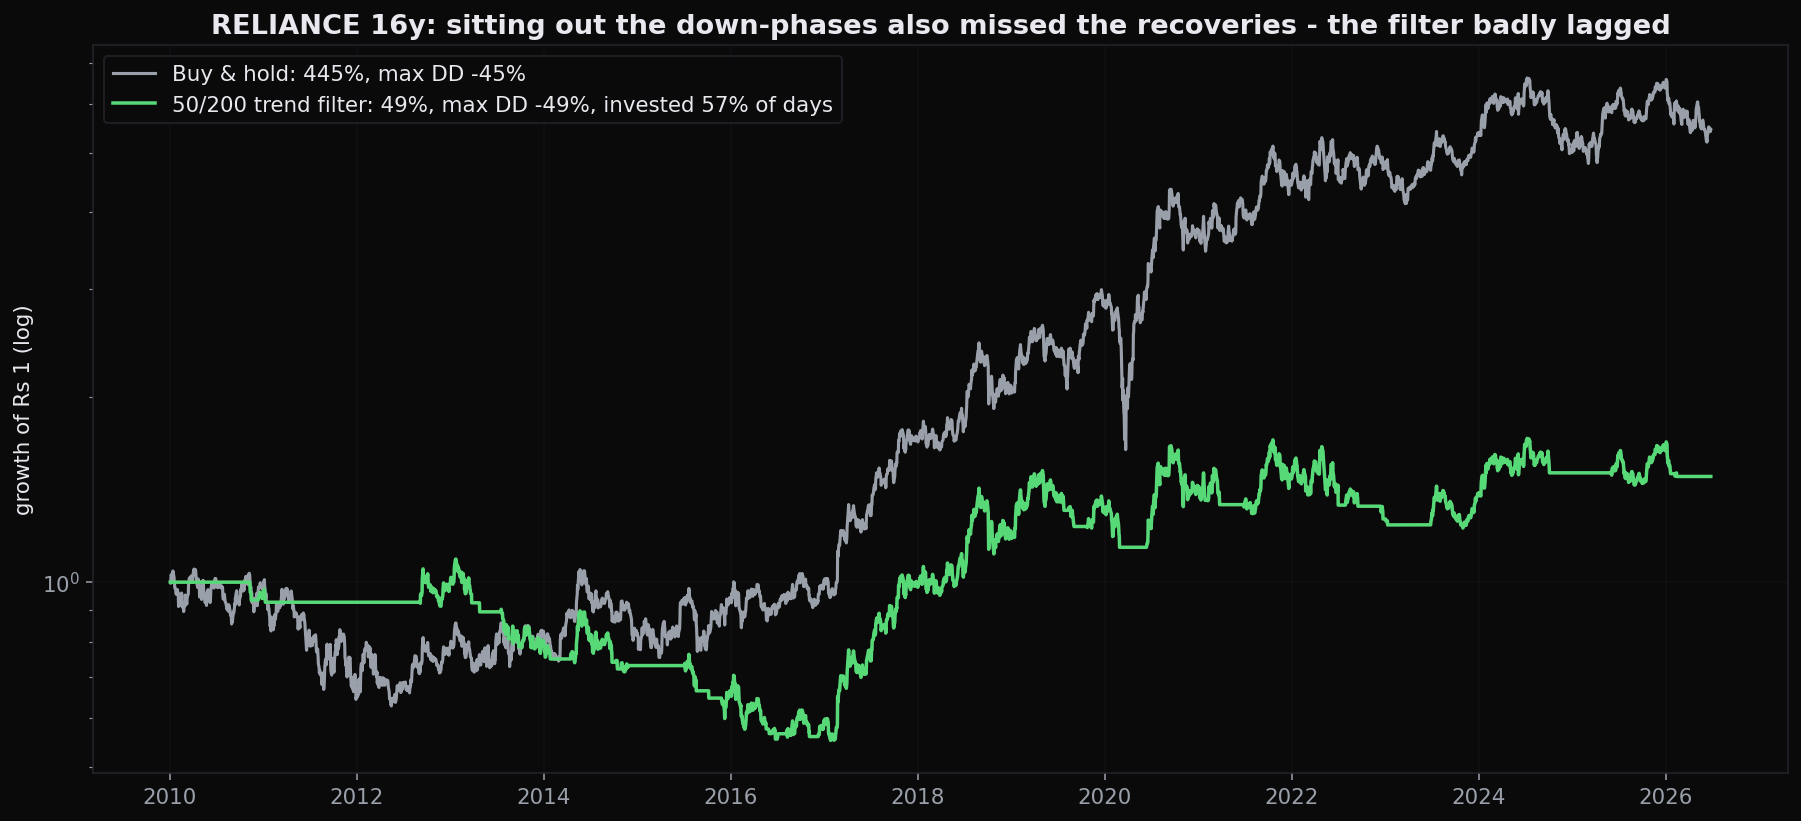
The RELIANCE curve tells the story behind the averages. The trend filter dutifully stepped aside during the big declines, which is good, but because the rule needs the trend to rebuild itself before buying back in, it sat in cash through the early, explosive part of every recovery. Markets often make their biggest single-day and single-week gains right off the lows, exactly when a slow trend filter is still parked in cash. Miss those, and you lag for years.
This is the trade-off no indicator can escape: a filter that protects you from the worst declines also locks you out of the best recoveries. Lag cuts both ways.
Win rate is not the same as edge
Beginners obsess over win rate, the percentage of trades that make money. It is the most misleading number in trading. You can win 90% of the time and still go broke if the 10% of losses are huge, and you can lose 60% of the time and grow rich if the 40% of wins are large enough.
What actually matters is expectancy, the average rupee result per trade. In plain terms, expectancy is your win rate times your average win, minus your loss rate times your average loss.
A system that wins just 40% of the time but makes 2 rupees on winners for every 1 it loses on losers still comes out ahead: 40% of 2 is 0.80, 60% of 1 is 0.60, which leaves +0.20 per rupee risked. It loses more often than it wins and still grinds upward. This is why the reward-to-risk ratio, how much you stand to gain compared with how much you put at risk, is the lever that pays. A trader who religiously cuts losers small and lets winners run can be wrong most of the time and still come out ahead.
Stop asking "how often does it win?" and start asking "what does it make per trade, after costs?" A high win rate with tiny wins and rare giant losses is a slow bankruptcy. A modest win rate with disciplined reward-to-risk is a business.
The trap that ruins every backtest: curve-fitting
Here is the seductive danger. Our trend filter underperformed, so the temptation is to tune it. Try 47 and 210 days instead of 50 and 200. Add a momentum condition. Skip trades in March. Keep twiddling and eventually you will find a combination that, on this exact slice of history, beat buy-and-hold spectacularly.
You will also have built something worthless. That is curve-fitting, also called overfitting: bending the rules until they perfectly explain the past, which guarantees nothing about the future. With enough knobs to turn you can match any old wiggle, and a system tuned to old noise will be helpless against new noise. The market does not repeat exactly; it rhymes, and a curve-fit system is memorising one verse instead of learning the rhyme.
The defences are simple and unforgiving:
- Prefer fewer rules and round numbers. A 50 and 200 filter you did not fiddle with is more trustworthy than a 47 and 213 one you tuned.
- Test on data the rule has never seen. Build the idea on one stretch of history, then check it on a stretch it never touched. A real edge survives the move; a curve-fit one falls apart. Traders call this an out-of-sample test.
- Test it across many stocks, as we did with 48, not on the one chart where it happened to look brilliant.
- Be suspicious of perfection. A backtest with no losing years and a silky-smooth curve is almost always overfit. Real edges are lumpy and uncomfortable.
If adding a rule makes the backtest much prettier, assume you are fitting noise until proven otherwise. The goal of a backtest is not to find the rule that fit the past best. It is to find a sturdy rule that will probably survive a future you cannot see.
From idea to a tested plan
Put the whole loop together:
- Write the rule as a sentence a stranger could follow, with context, trigger, and exit all defined in advance.
- Backtest it honestly across many stocks and a long history, with costs included.
- Read the equity curve and the worst drop, not just the headline return. A smoother −47% beat a richer −56% for many traders' nerves.
- Resist tuning. If it only works after heavy fiddling, it probably does not work.
- Decide what you are actually buying, return, smoothness, or time out of the market, and accept the trade-off with open eyes.
Quick recap
- A plan is four answered questions: context, trigger, exit, and size, all fixed before the trade.
- Define entry, exit-when-right, and exit-when-wrong in advance; the calm decision beats the heat-of-the-moment one.
- Our simple trend filter beat buy-and-hold in only 8% of 48 stocks; median +107% versus +744%, but with a shallower −47% worst drop and only about 55% of the time invested. A simple rule mostly underperforms holding while controlling the downside.
- The equity curve reveals the trade-off: protection from the worst declines costs you the best recoveries. Lag cuts both ways.
- Judge a system by expectancy and reward-to-risk, not by win rate.
- Curve-fitting makes the past look perfect and the future fail. Prefer few rules, round numbers, and tests on data the rule has never seen.
A tested plan tells you what to do; it cannot tell you how much to risk on each trade, and that single decision matters more than the rule itself. Next, we put risk first: stops, reward-to-risk, the 1% to 2% rule, and the brutal math of drawdown.