Fibonacci: The Pullback Map
After a big move, how far does price pull back before resuming? Fibonacci's 38.2%, 50% and 61.8% levels give a surprisingly useful map. See where they held, and failed, on real Indian charts.
- ·Where Fibonacci ratios come from
- ·Drawing a retracement
- ·The 38.2 / 50 / 61.8 levels
- ·Extensions for targets
- ·Confluence with support/resistance
- ·Why Fibonacci is a guide, not magic
After a stock climbs for months, it almost never travels in a straight line. It surges, then it pauses for breath, slipping back to let late buyers in and early buyers out, before (sometimes) carrying on up. The hard question every trader faces in that pause is brutally simple: how far does it fall before it is worth buying again, and how far before the move is actually broken?
Fibonacci retracements try to answer that with a kind of ruler. You take the big move that just happened, slice it into a few set percentages, 38.2 percent, 50 percent, 61.8 percent, and watch whether price steadies at one of those lines. (A retracement is just a partial give-back of a prior move.) It can sound like numerology, and parts of it are. But used as a map of likely pullback zones rather than a magic floor, it is one of the more honest tools in the chartist's kit. Let us see where the lines come from, how to draw them, and exactly where they held and where they slipped on a real Indian chart.
Where the ratios come from
The Fibonacci sequence is the one most people meet in school. Each number is the sum of the two before it, running 0, 1, 1, 2, 3, 5, 8, 13, 21, 34, 55, 89, 144, 233, and on forever.
The interesting part is not the numbers themselves but the ratios between them. (A ratio is just one number divided by another.) Divide any number by the next one along and, as the sequence grows, the answer settles near 0.618 (for example, 89 divided by 144 is 0.6181). Divide a number by the one two places ahead and you get about 0.382 (55 divided by 144 is 0.382). Three places ahead gives roughly 0.236. That 0.618 figure is the famous golden ratio, and it turns up in sunflower seeds, seashells, and Renaissance architecture, which is exactly why it picked up a mystical reputation it does not deserve in markets.
The retracement levels traders draw are simply those ratios, written as percentages of a price move:
- 23.6 percent, a shallow dip, common in very strong trends.
- 38.2 percent, the first level most traders watch.
- 50 percent, which is strictly not a Fibonacci number at all. It survives because Charles Dow noted a century ago that moves often give back about half. It is bolted onto the toolkit by tradition, not by maths.
- 61.8 percent, the "golden" retracement, the deepest pullback a healthy trend usually tolerates.
- 78.6 percent, the square root of 0.618, a last-ditch level. Beyond it, the original move is usually considered broken.
The 50 percent line is the most-watched Fibonacci level, and it is not a Fibonacci ratio. That single fact should tell you how much of this tool is geometry and how much is crowd habit. It works partly because so many people draw the same lines, a self-fulfilling convenience, not a law of nature.
Drawing a retracement
A retracement measures how much of a completed move has been given back. You anchor it between the two ends of one clear swing (a swing being one decisive move from a low to a high, or a high to a low):
- In an uptrend, click the swing low and drag to the swing high. The tool draws horizontal lines at each ratio below the high. These are possible support zones where a pullback may steady.
- In a downtrend, do the reverse: anchor the swing high and drag to the swing low. The lines mark possible resistance on a bounce.
The whole tool lives or dies on picking the right swing points. Use the obvious, important high and low that any trader would see, not some tiny intraday wiggle. If two analysts pick different anchor points, they get different levels, and "Fibonacci" suddenly disagrees with itself. That ambiguity is the first honest limitation.
You do not need special software to see the grid. Given the swing high and low, the levels are pure arithmetic: measure the size of the move (the swing high minus the swing low), then subtract each ratio of that move down from the high to find its line.
The 38.2, 50, and 61.8 zone on a real chart
Take Bajaj Finance. From its swing low of 553.5 on 28 March 2023 it rallied to a swing high of 1094.2 on 23 October 2025, a move of about 540 rupees. Anchor a retracement across that swing and the grid falls out like this:
| Level | Price |
|---|---|
| 0% (the high) | 1,094.2 |
| 23.6% | 966.6 |
| 38.2% | 887.7 |
| 50% | 823.9 |
| 61.8% | 760.0 |
| 78.6% | 669.2 |
| 100% (the low) | 553.5 |
When the pullback came, price slid to roughly 788, about a 56.6 percent retracement of the rally, landing squarely between the 50 percent line (about 824) and the 61.8 percent line (about 760) before steadying and resuming higher.
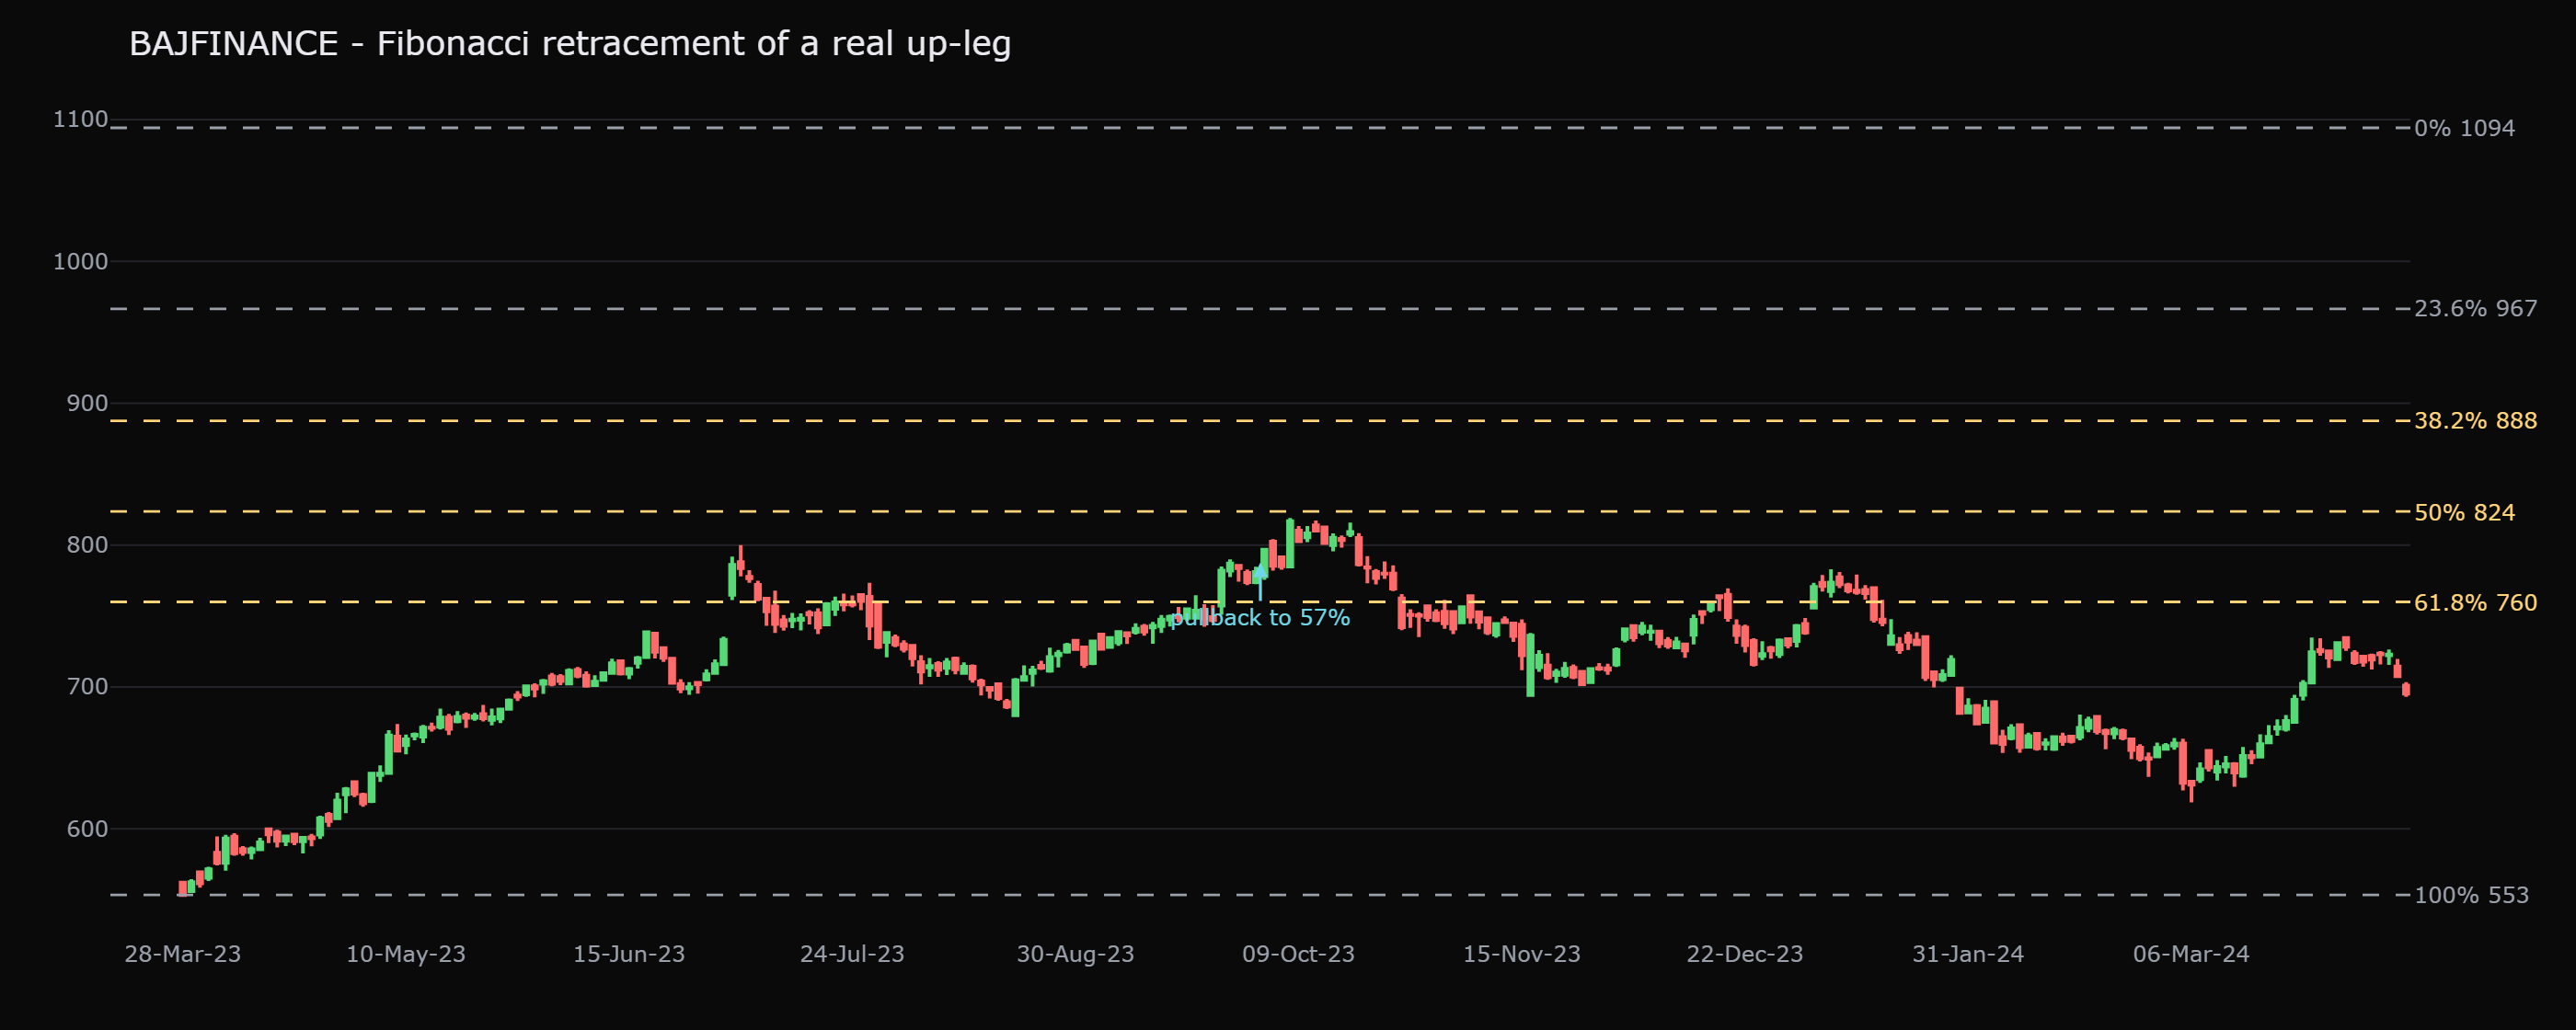
Notice what actually happened, versus the fantasy. Price did not stop to the paisa on a single line. It sank into the band between 50 percent and 61.8 percent, the deepest zone a strong trend usually tolerates, and turned somewhere inside it. That is how Fibonacci behaves at its best. It frames a region to watch for evidence of a turn, not a precise number to set a blind buy order at.
Treat the gap between the 50 percent and 61.8 percent levels as the "decision zone." A trend that pulls back into it and then shows a turn (a hammer candle, a bullish engulfing pattern, a pickup in volume) is doing what healthy trends do. A trend that slices straight through the 61.8 percent line and keeps falling is telling you the move may be over. The line is your cue to look closely, never a reason to buy all by itself.
Extensions: projecting a target
Retracements look backward, at how much was given back. Extensions look forward, at how far the next leg might travel once the pullback ends. They use ratios beyond 100 percent: 127.2 percent (the square root of 1.618), 161.8 percent (the golden ratio itself), and 261.8 percent.
The common method: measure the original move, then project that distance forward from the end of the pullback. If a stock rallies 100 rupees, pulls back, and resumes, a 161.8 percent extension projects a target 161.8 rupees above the pullback low. Swing traders use these as logical places to consider trimming a position, not as guarantees the stock will get there. An extension is a guess about possible reward, to be weighed against your risk, nothing more.
Confluence: where Fibonacci earns its keep
A Fibonacci level on its own is a thin reason to act. The tool becomes genuinely useful when a retracement line lands right on top of something that already matters for an independent reason, what chartists call confluence (two or more separate signals pointing at the same price):
- A 61.8 percent retracement that lines up with a prior support or resistance level from months ago.
- A 50 percent line sitting on a rising 50-day moving average.
- A retracement zone overlapping a round number (1,000 or 1,500) where orders cluster.
- A level that also matches a retracement drawn on the weekly chart.
When three unrelated reasons point at the same price, that price deserves your attention. When only the Fibonacci line points there, it usually does not.
Fibonacci is a confluence amplifier, not a standalone signal. Its job is to tell you which of the many prices on a chart already worth watching is also a natural retracement level. Stack it with support, a moving average, or a round number; never trade it alone.
Why it is a guide, not magic
Here is the honest part the gurus skip. Markets do not bounce at 61.8 percent because the universe loves the golden ratio. They bounce there partly because enough traders expect them to and place their orders accordingly, and partly because deep-but-not-total pullbacks are simply normal in trends. Strip away the mysticism and a retracement zone is just a sensible region to look for a turn, an edge when it is confirmed, not a floor.
And edges in this game are small. Recall a measured cousin of this idea: across years of Nifty 50 data, a dip to a rising 50-day moving average returned about 0.67 percent over the next 10 days, against a 0.58 percent baseline for any uptrend day. That is a real, repeatable tilt, and it is tiny. A Fibonacci zone has the same character. It is a place where the odds lean very slightly your way if the rest of the chart agrees, and where a stop-loss just beyond the level keeps your losses small when it does not.
The deadliest mistake with this tool is drawing the lines after you already want to buy, then choosing whichever anchor points make a level appear right where price is sitting now. That is not analysis; it is decoration. Pick your swing high and low first, from the obvious structure, and let the levels fall where they fall, even if they land somewhere inconvenient.
Quick recap
- Fibonacci ratios, 23.6, 38.2, 61.8 percent, come from dividing the sequence's numbers; the popular 50 percent is a Dow halfway level, not a Fibonacci number at all.
- Draw a retracement by anchoring the swing low to swing high (uptrend) or high to low (downtrend); the lines mark possible support or resistance.
- On Bajaj Finance's rally from 553.5 to 1094.2, the pullback bottomed near 788 (about 56.6 percent), inside the 50 to 61.8 percent decision zone, before resuming, a region, not a precise line.
- Extensions (127.2, 161.8 percent) project forward to frame possible targets, never guaranteed ones.
- Fibonacci earns its keep through confluence, when a level overlaps prior support, a moving average, or a round number.
- It is a guide, not magic: a small, confirmable edge, best traded with a stop just beyond the level, never a floor to lean on blindly.
Next we shrink the timeframe right down to a single bar and ask what one candlestick can, and cannot, tell you about a turn.