Why a Pattern Only Matters in Context
A hammer in the middle of nowhere means nothing; a hammer at strong support is a signal. Learn to combine candles with trend, levels and volume, and to ignore the many that lead nowhere.
- ·Patterns at support and resistance
- ·Patterns with and against the trend
- ·Volume confirmation
- ·Why most patterns fail
- ·Building a confirmation checklist
- ·Avoiding pattern-spotting bias
Here is an experiment you can run on any chart, even today. Pick a long, boring stretch where a stock just drifts sideways, going nowhere. Now hunt through it for every hammer, every doji, every engulfing candle you learned in the last two chapters. You will find dozens of them. Then check what happened after each one. Almost all led nowhere. Price simply wandered on as if the "pattern" had never appeared. The shapes were real. The signals were noise.
That is the uncomfortable truth this chapter is built on: a candlestick pattern, all by itself, has almost no power to predict anything. A hammer in the middle of a featureless drift means nothing. The identical hammer at a support level, a price floor, that has held three times, in a stock that has been falling into it, on a day of heavy volume, is a genuine setup. Same candle, opposite worth. The only thing that changed is the context around it, the situation the candle formed in. Learning to read that context is the difference between collecting pretty shapes and actually trading.
Why context is everything
A candle pattern is a snapshot of one short tussle between buyers and sellers. Context is the answer to three questions about where that tussle happened.
- At what level? Is the pattern forming at a price the market cares about, support, resistance, a prior high or low, a round number, or in the middle of nowhere?
- With or against the trend? Does the pattern point the same way as the larger trend, the general direction price has been heading, or is it betting against it?
- On what volume? Did the pattern form on conviction, meaning heavy participation with many shares traded, or on a thin, sleepy session?
A pattern that scores well on all three is worth acting on. A pattern that scores well on none is decoration. Most patterns you will spot land somewhere in between, and learning to grade them is the real skill.
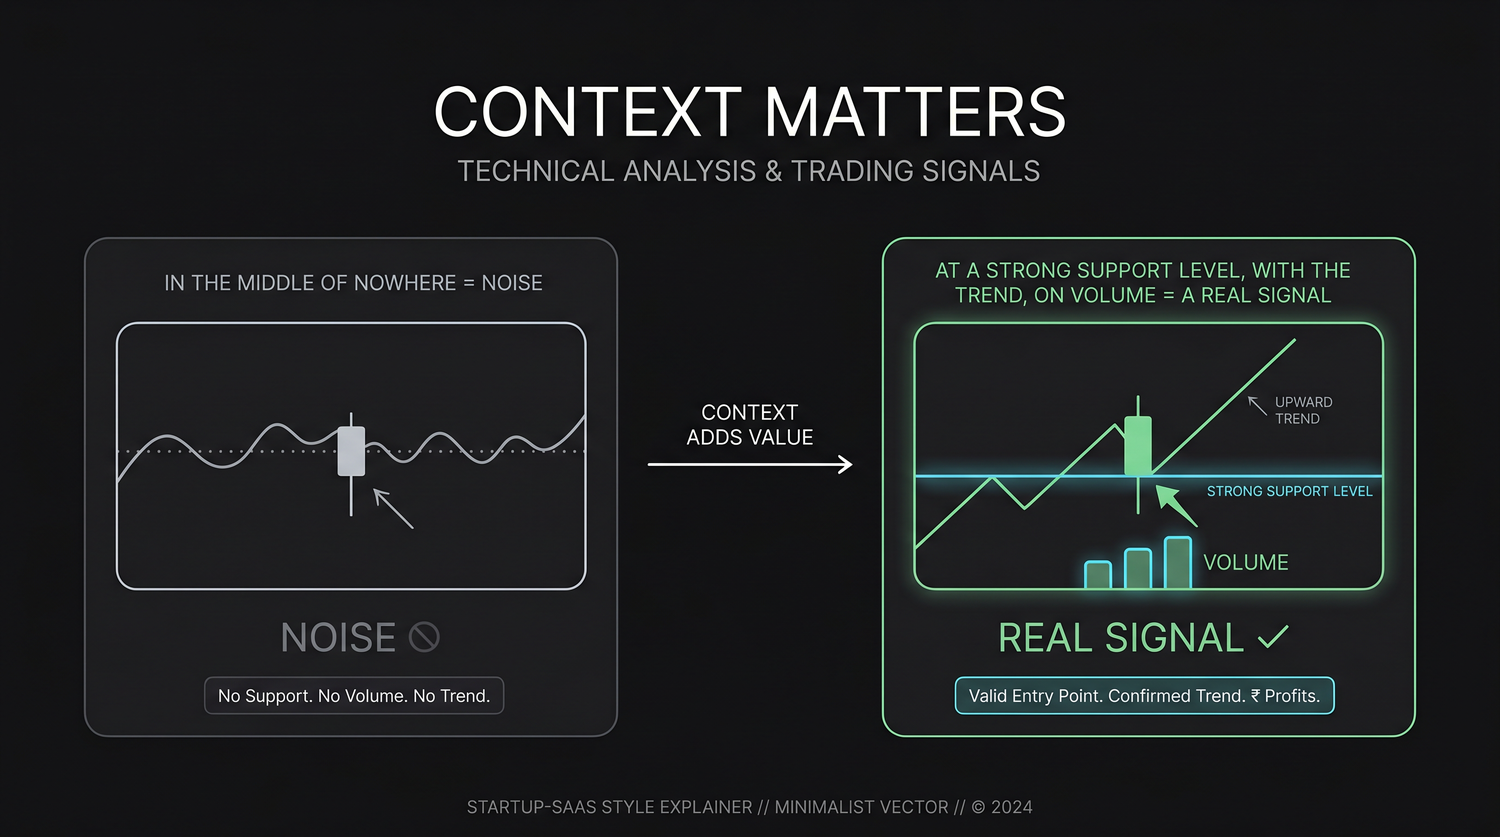
Patterns at support and resistance
The single biggest filter is location. Levels are where the crowd's memory lives, the prices where buyers stepped in before, where sellers capped the move before. A reversal pattern is the chart's way of saying "the pressure that was here just got rejected." That sentence only means something if "here" is a place where rejection was plausible in the first place.
- A hammer or bullish engulfing at established support is a high-quality signal. You have an independent reason to expect buyers, the level, and visible evidence that they showed up, the candle, and the two agree.
- A shooting star or bearish engulfing at established resistance is the bearish version of the same thing.
- The same patterns in open space, with no level nearby, are low quality. There is no reason for the move to stall there beyond the candle itself, and one candle is a thin reason.
This is also why Fibonacci levels, support and resistance, and candlesticks are taught close together. A candle pattern that forms at a Fibonacci retracement level that also lines up with prior support is three independent witnesses pointing at one price. That stacking up of reasons is called confluence, and it is what turns a coin toss into an edge.
Always mark the level before you look for the pattern, not after. Draw your support and resistance on a clean chart first; then a reversal candle that prints exactly at one of those lines is meaningful precisely because you were not hunting for it. A pattern you only "found" because you were staring at the current price is your own bias talking, not the chart.
Patterns with and against the trend
The second filter is direction. A pattern that agrees with the larger trend is sailing with the wind; one that fights it is spitting into the wind.
In a healthy uptrend, the high-percentage play is to use bullish reversal patterns at pullback lows, a hammer where the rising trend dips back to support, to rejoin the trend. The losing habit is trying to pick a top with a bearish pattern at every minor stall. Counter-trend reversals, turns against the main direction, do happen, and the big ones are spotted exactly this way, but they fail far more often than signals that go with the flow. A bearish engulfing in the middle of a roaring uptrend usually marks a pause, not the end.
This is also the trap in single candles from two chapters ago: a long-lower-wick candle is a hammer, which is bullish, in a downtrend, but a hanging man, which is bearish, in an uptrend. The candle cannot be graded until you know the trend it sits in. Context does not just strengthen the signal, it can flip its meaning entirely.
The easiest rule for a beginner: by default, trade reversal patterns that point back into the trend after a pullback, and be suspicious of patterns that fight a strong trend. "The trend is your friend" is a cliche, but the data behind it is not. Signals that line up with the larger move clear a much lower bar to work than signals trying to call its top.
Volume confirmation
The third filter is conviction, and volume is how you measure it. Volume is simply the number of shares that changed hands. A reversal pattern formed on heavy volume means a lot of people were involved in the change of control. The same pattern on thin volume may be a handful of trades that will not stick.
The cleanest evidence for this comes from breakouts, a close cousin of candle patterns. A breakout is the moment price pushes past an important level. A 20-day breakout, where price clears its highest point of the past 20 days, fails about 56% of the time, sliding back below the breakout within five days. That is worse than a coin toss. But filter for breakouts on more than 1.5 times the average volume, and the failure rate falls to about 47%, with better follow-through. Volume does not make the signal a sure thing; it shifts it from a losing bet toward a slight edge. The same logic applies to a candle pattern: an engulfing on a volume spike is worth a lot more than the identical shape on a quiet day.
A 20-day breakout fails about 56% of the time on its own; adding a volume filter (more than 1.5 times average) cuts the failure rate to roughly 47% and improves returns. The numbers to remember are not 56 or 47, it is the idea: even a respected signal can fail more often than it works alone, and confirmation is what tilts the odds. Treat candlestick patterns with exactly the same humility.
Why most patterns fail
It is worth being blunt about the base rate, the plain background odds. Most candlestick patterns, taken in isolation, do not give you a meaningful edge over simply being invested. Across years of Nifty 50 data, the average stock drifts up about 1.48% over any 20-day window just by existing in a long-term uptrend. A pattern has to beat that to be worth the effort and the trading costs, and most, on their own, barely manage it.
The reason is not that the patterns are fake. It is that markets are mostly noise, candles are tiny samples, and any shape will appear thousands of times by pure chance. The patterns that do earn their keep are the minority that form at the right place, in the right direction, with the right conviction. Context is not a nice garnish on top of the pattern. Context is where essentially all of the edge lives. The candle is the trigger; the level, the trend and the volume are the reason.
A confirmation checklist
Turn all of this into a routine you run before acting on any candlestick pattern. If a setup cannot tick most of these boxes, pass on it. There will always be another.
- Level: Is the pattern forming at a meaningful support or resistance, a prior high or low, a round number, or a Fibonacci level? If there is no level, skip it.
- Trend: Does the signal line up with the larger trend, or is it a high-conviction reversal at the end of an extended move? A mid-trend counter-trade is a skip.
- Volume: Did the pattern form on above-average volume, or on a thin session? Thin volume is a downgrade.
- Location in the swing: Is price at a pullback extreme, a logical turning point, or stretched far from any reference point? Mid-air is a skip.
- Confluence: How many independent reasons point at this price? One is weak; three is a setup.
- Risk first: Is there a sensible place for a stop just beyond the pattern's extreme, and does the potential reward justify it? No clean stop is a skip.
The checklist exists to make you say no. A candle pattern is a reason to investigate, never an automatic reason to trade. The discipline is in walking away from the dozens of patterns that do not clear the bar, because the cost of trading every shape you see is a thousand small losses that no winning setup can repay.
Avoiding pattern-spotting bias
A final, very human warning. Once you learn these patterns, your brain starts seeing them everywhere, especially in the direction you already want price to go. This is confirmation bias, the habit of noticing only the evidence that supports what you already believe, wearing a chartist's hat. You want the stock to rise, so you notice the one hammer and overlook the three failed hammers right beside it, and you stretch the definition until any old candle qualifies.
The defences are concrete. Mark your levels and trend on a clean chart first, before looking for any pattern, so the structure is not bent to fit your hope. Apply the same definition every time: a hammer's lower wick is at least twice its body, or it is not a hammer. And keep a journal: when you log every pattern you traded and how it turned out, the patterns that do not actually work stop fooling you, because the written record argues back. The chart does not care what you want. Your job is to read what is there, not to draw what you wish were there.
The pattern is the least important part of a good setup. Where it forms, which way the trend runs, and whether volume confirms it carry the edge. Master the context and average patterns become useful; ignore the context and even the best patterns become a slot machine. Read the whole chart, not the candle.
Quick recap
- A pattern's worth is decided by context, not its shape: the same hammer is a signal at support and noise in open space.
- Grade every pattern on three filters, level, trend alignment and volume, and prize confluence when independent reasons stack on one price.
- Most patterns fail on their own; they must beat the market's natural 1.48% drift over 20 days, and confirmation (as with breakouts: about 56% failure alone, about 47% with volume) is what shifts the odds.
- Run a confirmation checklist designed to make you say no, and always define risk before acting.
- Beware pattern-spotting bias: mark levels on a clean chart first, use fixed definitions, and let a journal argue back.
That closes the candlestick module. Next we step up to the bigger shapes that play out over weeks, the head and shoulders, double tops and double bottoms that mark the end of whole trends.