Channels, Ranges & the Breakout
Markets spend most of their time going sideways. Learn to trade the channel and the range, tell a real breakout from a fakeout, and understand the throwback that traps impatient traders.
- ·Drawing channels and ranges
- ·Trading inside a range
- ·Breakout vs false breakout (fakeout)
- ·Volume on a breakout
- ·The throwback / retest
- ·Range-to-trend transitions
Markets only travel in clean, straight trends about a third of the time. The rest of their life is spent drifting sideways, coiling up, and tricking people. That is awkward, because the breakout, the moment price finally bursts out of a sideways zone, is the single most exciting event on a chart, and excitement is exactly when traders make their worst decisions. The breakout looks like the start of a big move every single time. Most of the time, it is a trap.
This chapter is about the two-thirds of market life that is not a clean trend: channels and ranges, how to trade inside them, and the moment they end. We will give the breakout the honest treatment the data demands, including the uncomfortable fact that more than half of all breakouts fail within a week. And we will cover the throwback, the small pullback right after a breakout that shakes out the impatient and rewards the patient.
Channels and ranges
A range is a sideways market: price bouncing between a flat support floor and a flat resistance ceiling. A channel is the same idea, just tilted, price moving between two parallel sloping lines, either an up-channel or a down-channel. Both are simply support and resistance working as a pair to box price in.
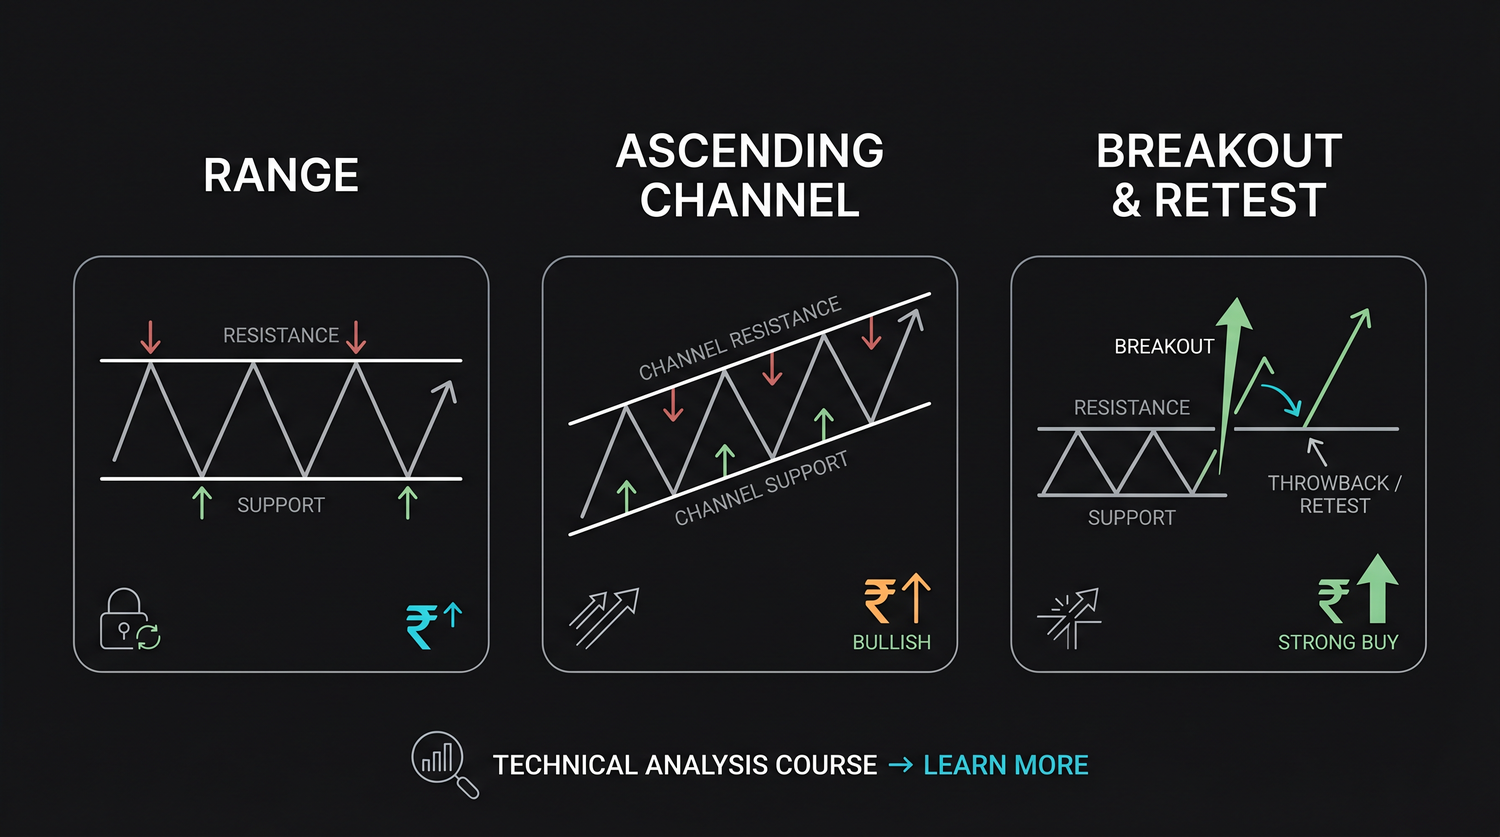
To draw a channel, first draw the trendline along the swing lows (in an uptrend) or the swing highs (in a downtrend), then draw a second, parallel line touching the opposite extremes. Price tends to travel between the two. A flat range is just the special case where both lines are horizontal. The discipline is the same as drawing any trendline: you need real touches at both boundaries, and you should refuse to force a channel that the price action does not actually respect.
Trading inside a range
While price is boxed in, the playbook flips everything a trend follower does on its head:
- Buy near support, sell near resistance. Trade the edges, not the middle. The best trades happen right at the boundaries, where you find out quickly and cheaply if you are wrong.
- The middle of the range is no-man's-land. Entering mid-range gives you a poor price and a fuzzy stop (the exit point where you admit you are wrong). Patience at the edges beats action in the middle.
- Your stop lives just outside the box. Buy support with a stop a little below it; sell resistance with a stop a little above. The break of the boundary is itself your "I was wrong" signal.
The simplest way to trade a range: let the boundary that just rejected price set both your entry and your risk. Buy at the support touch with a stop just under the floor, small risk, the whole height of the range as potential reward. The trader who waits for the edge gets a better price and a tighter stop than the one who jumps in mid-range out of boredom.
Breakout versus fakeout, the number that matters
Eventually price leaves the box. A breakout is a close beyond the boundary, above range resistance or below range support, and it seems to promise a brand-new trend. That promise is broken more often than it is kept.
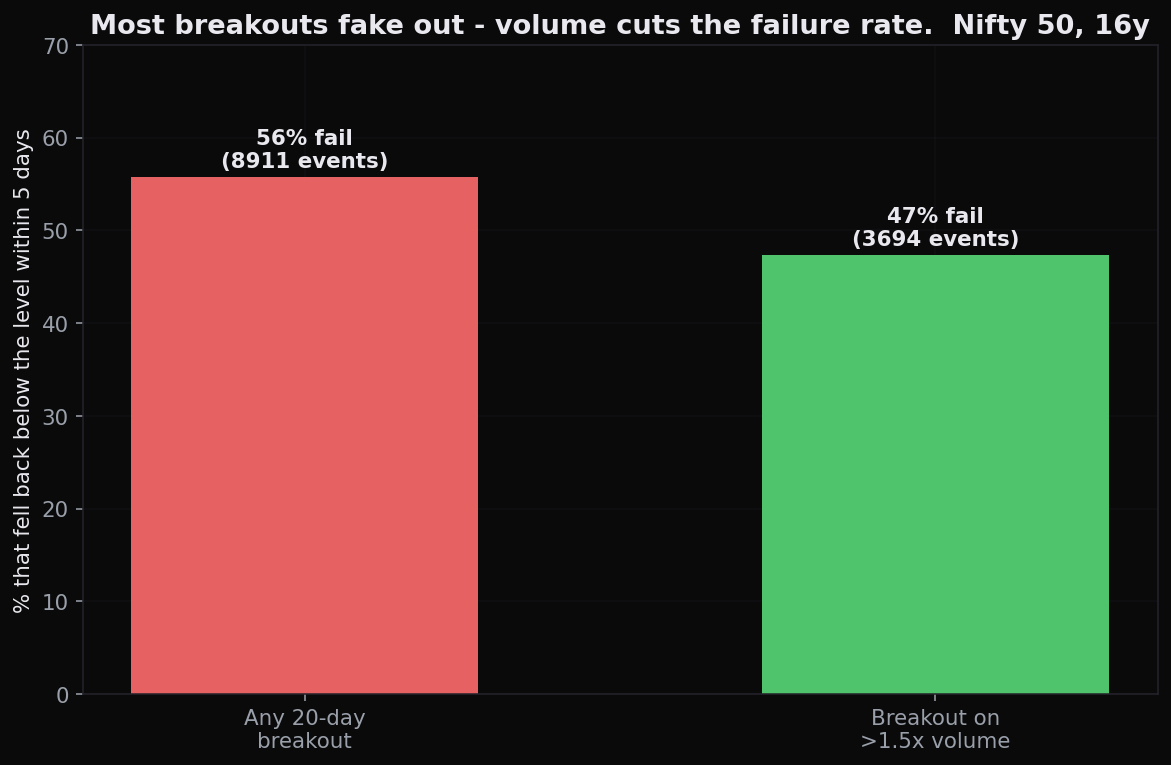
Here is the measured truth across 16 years of Nifty 50 data: of all 20-day breakouts, 56 percent were fakeouts. Price closed beyond the level and then fell back inside the range within 5 sessions. More than half. A fakeout, as the name suggests, is a breakout that fakes you out and then reverses. So the breakout that looks like the obvious start of a trend is, on the base rate alone, slightly more likely to be a trap than a launch. (A base rate is just how often something happens on average across many cases.)
The breakout is the most over-traded event in all of technical analysis, precisely because it feels so convincing. A clean break of an obvious level triggers a rush of buyers, and that rush is exactly what lets bigger players sell into the move and push it back inside. Treat every fresh breakout as guilty until proven innocent.
Volume on a breakout
If most breakouts fail, what separates the real ones? Conviction, and conviction shows up as volume, the number of shares traded. A genuine breakout should arrive on a surge of volume. That surge means real demand is overwhelming the supply that had been capping price, not just a few stray orders nudging it over the line on a quiet day.
The data backs this up, with appropriate humility. Filtering for breakouts on more than 1.5 times the average volume cut the fakeout rate from 56 percent to 47 percent, and those breakouts also delivered better returns afterwards. That is a real, worthwhile improvement. It is also still close to a coin flip: nearly half of even the high-volume breakouts failed.
Volume helps; it does not save you. A breakout on more than 1.5 times average volume failed 47 percent of the time, against 56 percent for breakouts overall. Demanding volume tilts the odds in your favour, from worse-than-even to roughly even, but no filter turns a breakout into a sure thing. Position size and a stop, not faith in a tall volume bar, are what keep you safe.
A simple, objective breakout test is to watch for a new 20-day high that arrives on above-average volume. That is a higher-quality breakout, not a guarantee, just better odds than a quiet one, and OpenAlgo's tools can flag those conditions for you.
A related caution carries over from how trends behave at their edges. A close that pokes just outside a band is not automatically a signal. In trending markets, price can ride along an upper boundary for a long time. A close above the upper Bollinger band, for instance (an upper volatility line we cover later), still returned about 0.58 percent over the next 10 days, meaning price kept drifting up rather than snapping back. "Touched the edge" is not the same as "must reverse," and it is not the same as "must keep going" either.
The throwback and the retest
Even a real breakout rarely runs cleanly. Price often surges out of the range and then comes back to the breakout level before resuming. After an upside break that return is called a throwback; after a downside break it is called a pullback, or retest. This is where the trapped-trader psychology from the last chapter pays off: the old resistance, now broken, becomes support, and price drifts back to test that flipped level.
The throwback is brutal for the impatient. Traders who chased the breakout at its high get a sudden loss as price falls back, panic out near the retest, and then watch the move resume without them. The patient trader does the opposite. Rather than chase the first break, they wait for the retest of the broken level, entering as the old ceiling proves itself the new floor. The entry comes at a better price, with a stop just on the other side of the level, and with much of the fakeout risk filtered out, because a fakeout usually fails to hold the level on the retest in the first place.
Do not chase the break. Wait for the box to be re-tested. A genuine breakout pulls back to the broken level and holds; a fakeout falls back through it and stays inside. Letting price come to you on the throwback both improves your entry and screens out a chunk of the 56 percent that were never going anywhere.
Range-to-trend transitions
Now the whole arc of this module clicks together. Ranges are where trends are born and where they die, accumulation and distribution, in Dow's language from Chapter 5. A long, dull range is the market quietly storing energy; the breakout is the release. The shift from range to trend is the most profitable single move on a chart when it is real, which is exactly why it gets faked so often.
So hold the two ideas together. Respect the range while it lasts, trade the edges, keep stops just outside the box. Respect the breakout when it comes, but demand volume, wait for the retest, and assume guilt until the level proves it has truly flipped. The market spends most of its time inside boxes. Your job is to trade the box honestly and to stay sceptical, not euphoric, on the day it finally breaks.
Quick recap
- A range is a sideways box between flat support and resistance; a channel is the same between parallel sloping lines (up or down).
- Inside a range: buy near support, sell near resistance, avoid the middle, and keep stops just outside the box.
- Most breakouts fail: 56 percent of 20-day breakouts fell back inside within 5 sessions. Treat a fresh breakout as guilty until proven innocent.
- Volume helps, it does not guarantee: breakouts on more than 1.5 times average volume failed 47 percent of the time (versus 56 percent) with better returns, better odds, still near a coin flip.
- Poking outside a boundary is not automatically a signal: a close above the upper Bollinger band still drifted about 0.58 percent over 10 days, price can walk the band.
- Do not chase. Wait for the throwback or retest. A real breakout returns to the broken level and holds (role reversal); a fakeout falls back through it.
That closes Module B on market structure. Next, in Module B's final level tool, Fibonacci gives us a map for how far price pulls back before the trend resumes.