The Candlestick: One Bar, Five Numbers, a Story
Body, wicks and colour, a single candle packs open, high, low and close into one shape. See how to read conviction, rejection and indecision from the candles on a live NSE chart.
- ·Body vs wick vs shadow
- ·Bullish and bearish candles
- ·Long wicks = rejection
- ·Marubozu and conviction
- ·What a single candle really says
- ·Reading candle size and context
Zoom all the way in on any chart, past the trends and the levels, and you arrive at the smallest building block in technical analysis: a single candlestick. It looks like a tiny box with a thread poking out of each end. It is actually a compressed story, a whole trading day of human hope, fear and second-guessing, packed into one shape you can read in under a second. Learn to read that one shape and every chart in this course becomes a sentence built from words you already know.
The candlestick is a Japanese invention, far older than the computer, and it survived for one simple reason: it shows you not just where price ended up, but who was in control on the way there. A plain line on a chart says "the price was here." A candle says "buyers tried to push it up, sellers slammed it back from this level, and by the closing bell the buyers had won, but only just." That is a richer kind of information, and it is free in every bar.
Five numbers, one shape
Each bar of data carries five numbers: the open, high, low and close, the OHLC you met last chapter, plus the volume traded. The candlestick draws four of them as a picture and leaves volume to a separate row beneath. Those four prices define the entire shape:
- The open and close mark the two ends of the thick rectangle in the middle.
- The high and low mark the tips of the thin threads above and below.
Two numbers for the box, two for the threads. That is the whole construction. From four prices, a shape; from the shape, a story.
You will rarely measure a candle's body and threads by hand, your charting screen draws them for you, but seeing how simply they come from those four prices makes it concrete. The candle is not a symbol that someone decided would mean "buy." It is a faithful, mechanical drawing of four real prices.
Anatomy: body, wick and shadow
Give the parts their names, because the rest of the course assumes them.
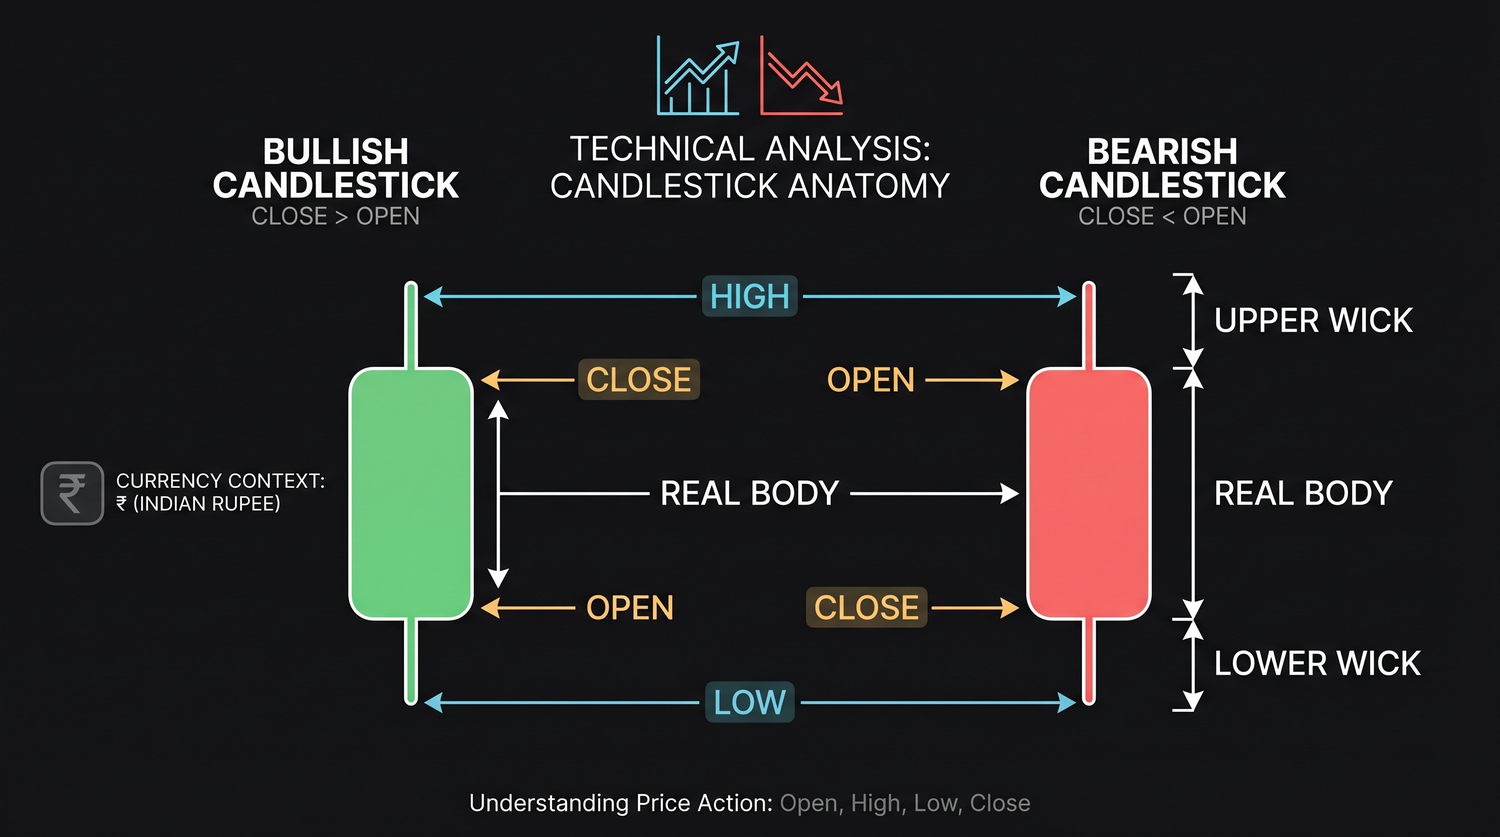
The body is the thick rectangle between the open and the close. Its length is the single most important feature of a candle. It measures how far price travelled, on balance, from start to finish, in other words the margin of victory for whichever side won.
The wicks, also called shadows, are the thin lines extending above and below the body. The upper wick reaches up to the high; the lower wick reaches down to the low. They record the ground that price covered during the period but could not hold on to. A long wick is the story of a push that got rejected.
That is the entire vocabulary: body, upper wick, lower wick. Everything else, every named pattern later in the course, is just combinations of these three parts across one, two or three candles.
Colour: bullish versus bearish
Colour answers one question instantly: did the period close higher or lower than it opened?
A bullish candle closes above its open, so the buyers ended in control. Bullish is just trader-speak for "leaning up", and such a candle is conventionally drawn green or hollow. A bearish candle closes below its open, so the sellers ended in control. Bearish means "leaning down", and it is drawn red or filled.
Watch the subtle part. The colour is not about whether the stock rose compared with yesterday. It is strictly open against close within this one period. A stock can gap down hard at the open, meaning it starts the day well below where it ended the day before, and still print a green candle if buyers clawed it back by the close. That nuance, green does not always mean "an up day", is exactly the kind of thing the colour reveals and a line chart hides.
The body answers two questions at once. Its colour says who won (close above or below the open), and its length says by how much. A long green body is decisive buying; a long red body is decisive selling; a tiny body of either colour is a near-draw. Before you name any pattern, just read the body. It is most of the message.
Long wicks: the language of rejection
If the body is conviction, the wicks are rejection, and they are where candlesticks earn their reputation. A long wick means price travelled a long way in one direction during the period and was then forcefully pushed back before the close.
A long lower wick says this: sellers drove the price down, buyers stepped in underneath, soaked up the selling, and lifted it back up by the bell. Buyers defended that lower zone. A long upper wick says the opposite: buyers pushed the price up, ran into a wall of selling, and were shoved back down. Sellers defended that upper zone.
The longer the wick compared with the body, the more emphatic the rejection. A candle with a small body and a long wick is one of the most informative single bars you can see, because it shows a clear shift of control within the period.
When a long wick appears, ask where it appeared, not just that it appeared. A long lower wick stabbing into a price level where the stock has bounced before is meaningful. The identical candle floating in empty space, with no level nearby, is mostly noise. The shape is the same; the context is everything, a point we build an entire chapter around later.
Marubozu and doji: the two extremes
Two named single candles sit at opposite ends of the conviction scale, and they are worth knowing now.
A marubozu is a candle that is almost all body, with little or no wick at either end. It opened at one extreme and closed at the other, marching in one direction the whole period with no real pushback. A green marubozu is pure, one-sided buying; a red one is pure, one-sided selling. It is the chart's clearest picture of conviction: one side was in control from the first trade to the last.
A doji is the mirror image: a candle with almost no body at all, because the open and the close finished at nearly the same price. Buyers and sellers fought all period and ended in a draw. A doji is the chart's clearest picture of indecision, a balance of power, a pause, a question mark. After a long run in one direction, that sudden balance can hint that the trend is tiring. Hint is the operative word.
Resist the urge to turn a single candle into a trade. A doji does not "mean reversal" and a hammer, a candle with a long lower wick, does not "mean buy", not on its own. One candle is a single data point in an ongoing fight, and the data shows clearly that isolated patterns barely beat doing nothing. A single candle can raise a question; only the surrounding trend, level and volume can begin to answer it. We measure exactly how weak lone patterns are when we reach the candlestick-pattern chapters.
Size and context: a candle whispers, it does not shout
Two final habits turn candle-reading from a parlour trick into a real skill.
First, read size relative to its neighbours, not in the abstract. A "big" candle only matters if it is big compared with the recent bars. A long green body that dwarfs the last ten candles signals a real surge of demand. The same body in a stock that swings that much every day is unremarkable. Always judge a candle against its own recent range.
Second, remember that a single candle whispers. It tells you who won one round, and how decisively, which is genuinely useful, but it cannot tell you the fight's final outcome. The story of a chart is told by candles in sequence. A long green body is more meaningful after a string of weak red ones; a doji counts for more at the top of a long climb than in the middle of a quiet drift. You are learning the alphabet here. The words and sentences, two- and three-candle patterns, and patterns read in full context, come later in the course, and they only make sense once a lone candle is second nature.
Quick recap
- A candlestick draws four of a bar's five numbers, open, high, low, close, as a shape; volume sits in a separate row.
- The body (open-to-close) shows conviction by its length and direction by its colour; the wicks (to the high and low) show how far price was pushed and rejected.
- Green or hollow closes above the open (buyers won); red or filled closes below (sellers won), strictly within that one period, not versus yesterday.
- A long wick is rejection, buyers or sellers defending a zone; a marubozu is one-sided conviction; a doji is indecision.
- Judge candle size against recent bars, and treat any single candle as a whisper, context (trend, level, volume) decides whether it matters.
- Isolated candle patterns barely beat doing nothing; their power, where it exists, comes only from where they appear.
Next, we pull back to ask a question that quietly decides everything you have just learned to read: which timeframe and scale are you looking at, and how the same chart can tell opposite stories depending on the answer.