Support & Resistance: Where Price Remembers
Prices turn at levels the crowd remembers. Learn how support and resistance form, why they flip roles once broken, and how to mark the levels that actually matter on a real NSE daily chart.
- ·What support and resistance are
- ·The psychology behind a level
- ·Role reversal after a break
- ·Round numbers and prior highs/lows
- ·Drawing zones, not exact lines
- ·Why levels eventually fail
Markets have a memory, and that memory is made of people. Think about a price where a crowd of buyers once rushed in, or where a wall of sellers once dumped their shares. That price gets remembered, by the people who traded there, by the people who wish they had, and by the people who got stuck. Months later, when price drifts back to that same level, those memories turn into fresh buy and sell orders, and the level often holds again.
That is the whole secret behind support and resistance. They are not magic lines drawn by some hidden hand. They are human memory, priced into the order book, the running list of all the buy and sell orders waiting in the market.
The trap is to treat these levels as solid walls that price bounces off forever. They are not. A good level is a zone where the odds of a turn improve a little, and every single one of them eventually fails. That failure is how new trends are born. This chapter is about marking the levels that genuinely matter, understanding why they form, and respecting the one truth most courses quietly skip: support and resistance exist to be tested, retested, and finally broken.
What support and resistance actually are
- Support is a price zone where buying has previously been strong enough to stop a fall. Demand (the desire to buy) overwhelms supply (the desire to sell), and price bounces.
- Resistance is a price zone where selling has previously been strong enough to stop a rise. Supply overwhelms demand, and price stalls.
That is all there is to it. Support is a floor where buyers keep turning up; resistance is a ceiling where sellers keep turning up. Both are simply the memory of where buyers and sellers last fought hardest, and the more often and more recently they fought there, the more the level matters.
Support and resistance are not about a line being "strong." They are about a price where enough traders share the same memory that their orders pile up in the same spot. The level holds because people act on the memory, right up until enough of them give up or get overrun.
The psychology behind a level
Why do orders pile up at a remembered price? Because of three groups of people, all staring at the same number.
- The ones who bought there and watched it work out. When price comes back to that level, they buy more, because "it worked last time."
- The ones who missed it. They watched price leave without them and swore they would buy if it ever came back. Now it has.
- The ones who got trapped. They bought too high, sat through a painful loss, and now just want out at breakeven (getting back to what they paid). When price returns to their entry price, they sell, creating resistance at the very spot where they once bought.
That third group is the engine behind role reversal, the most useful idea in this chapter. Notice that all three groups are reacting to the same level for completely different reasons, and their combined orders are what make the bounce or the rejection actually happen. The level works partly because everyone can see it, which makes it a bit of a self-fulfilling prophecy.
Round numbers and old highs and lows
Where do these levels come from? A few reliable sources:
- Prior swing highs and lows, the peaks and valleys on the chart. These are the most important. An old peak becomes resistance; an old valley becomes support. The price structure itself remembers them.
- Round numbers, like 100, 500, 1000, 1500. People naturally place orders at tidy figures, so stops, targets, and alerts all cluster there, and price often reacts at psychologically "big" numbers even with no prior history.
- Prior consolidation zones, areas where price spent a long time drifting sideways. A lot of shares changed hands there, so a lot of memories live there, and the zone tends to act as both a magnet and a barrier later.
The strongest levels are the ones with two reasons at once, an old peak that also happens to sit near a round number like 1500, say. When two separate reasons point at the same zone, more traders see it, more orders gather, and the level carries more weight. That overlap has a name, confluence, and it comes back in the Fibonacci chapter.
Role reversal: the floor becomes the ceiling
The single most practical habit of these levels is that once they break, they swap jobs. Broken resistance turns into support; broken support turns into resistance.
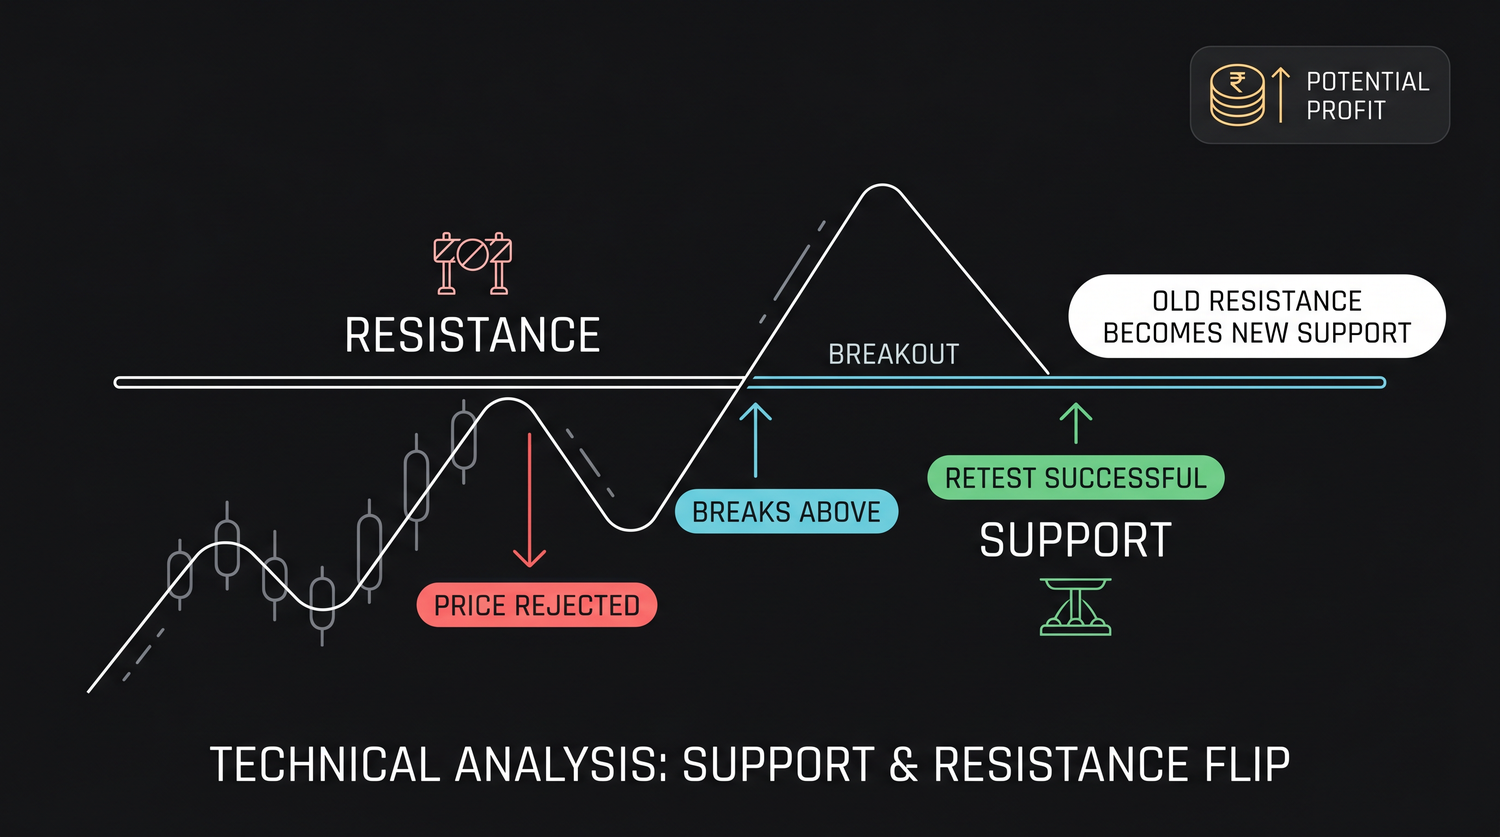
The mechanism is the trapped-trader story again. While a level is acting as resistance, sellers gather there and the rally stalls. Once price breaks above it and holds, the people who bought just below are now sitting in profit, the doubters who sold are now wrong and want back in, and a fresh group is keen to buy any dip back to the breakout point. So the old ceiling becomes the new floor. This is why a retest, price coming back to touch the level from the other side, is one of the cleaner, lower-risk entries in technical analysis. You are buying at a level the market has just shown it will defend.
Draw zones, not lines
Beginners draw support and resistance as a single, pixel-perfect line, and then feel cheated when price overshoots it by a few rupees. Experienced traders draw zones, a band a little wider than a single price, because that is how levels actually behave.
A level is a region of agreement, not an exact number. Wicks poke through it (the thin lines above and below a candle's body), closes pull back inside it, and different traders remember slightly different prices. Mark the zone from the cluster of highs or lows, not from the one most extreme tick. A simple starting point is to let a recent swing high and swing low define a band, say the highest high and lowest low of the last 20 sessions, and then let price show you which edges actually matter. OpenAlgo's tools can work those boundaries out for you, but treat them as zones to watch, never as exact lines to trade blindly.
Why levels eventually fail, tested and broken
Here is the honest part that most courses frame badly: a level's whole job is to be broken eventually. Support and resistance are not permanent walls. They are pressure points that hold until the balance between buyers and sellers shifts, and then they give way. Watching how many times a level is tested before it breaks tells you more than the level itself does.
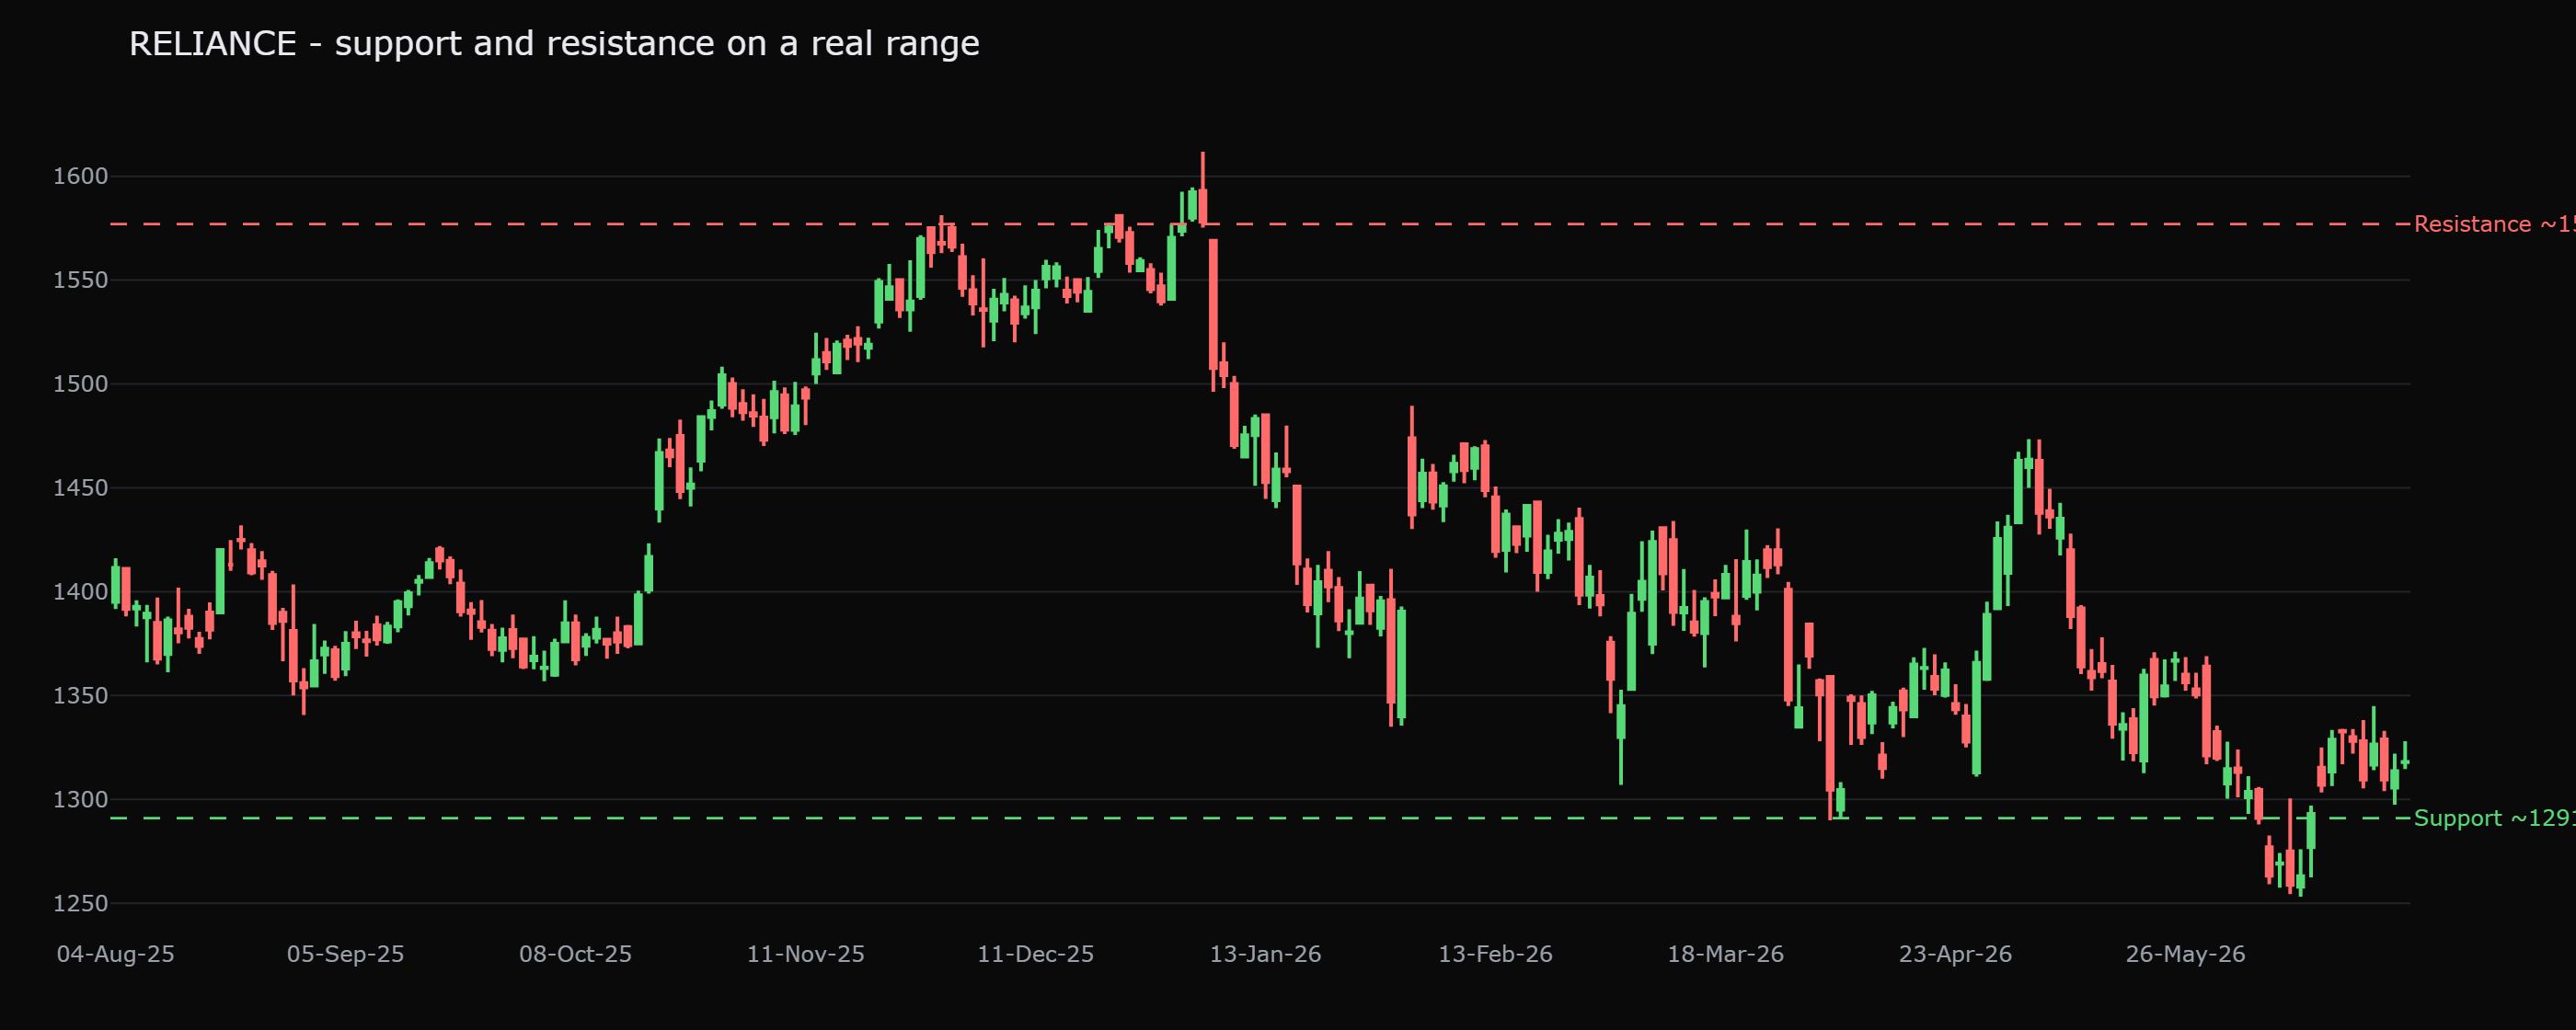
On this RELIANCE chart, resistance near 1577 was tested on 14 separate sessions, and support near 1291 on 13 sessions. Read that carefully. Those are not 14 happy little bounces proving the level is unbreakable. They are 14 attacks. Each retest chips away at the sellers sitting there, soaking up their orders, until one day the supply is exhausted and price punches through. A level tested over and over is not getting stronger, it is being worn down, and a much-tested ceiling that finally cracks often releases a sharp move, because so much pent-up buying was sitting just above it.
Do not confuse "tested many times" with "will hold forever." Repeated tests are a countdown, not a guarantee. The more often price grinds against a level, the more you should prepare for the break, and the breakout, not the bounce, is frequently the bigger trade. The next chapter shows why even that breakout fools you most of the time.
Levels are zones, not lines, and they are temporary. RELIANCE's resistance at about 1577 (14 tests) and support at about 1291 (13 tests) held again and again, until they did not. That is the normal life cycle of every support and resistance level: form, get tested, get retested, and eventually give way to a new trend.
Putting it together
Mark the zones where price has a memory, old swings, round numbers, busy sideways patches, and draw them as bands, not razor-thin lines. Expect broken levels to flip roles, and treat the retest as your higher-quality entry. Above all, hold two ideas in your head at once: a level improves your odds of a turn, and it will eventually fail. The trader who respects the level but stays mentally ready for its break is the one who neither fights the bounce nor gets blindsided by the breakout.
Quick recap
- Support is a floor where buyers repeatedly step in; resistance is a ceiling where sellers repeatedly step in. Both are crowd memory of where buyers and sellers last fought.
- The psychology is three groups acting on one price: those who bought there, those who missed it, and the trapped traders waiting to get out at breakeven.
- Role reversal: broken resistance becomes support and the other way round; the retest of a broken level is a cleaner, lower-risk entry.
- Levels come from old swing highs and lows, round numbers, and old consolidation zones, and are strongest where two reasons overlap (confluence).
- Draw zones, not lines, a band around the cluster of highs or lows, because wicks overshoot and traders remember slightly different prices.
- Every level eventually fails by design: RELIANCE's resistance near 1577 was tested on 14 sessions and support near 1291 on 13 before giving way. Repeated tests are a countdown, not a fortress.
Next: what happens after a level breaks, channels, ranges, and the breakout that fools traders more than half the time.