RSI and the Momentum Oscillators
Momentum oscillators measure how fast price is moving, not just where. Start with the RSI, then meet the Stochastic, CCI, Williams %R and Stochastic RSI, and learn why 'overbought' is not a sell button.
- ·What momentum and an oscillator are
- ·RSI from 0 to 100
- ·Why overbought can stay overbought
- ·Stochastic, CCI and Williams %R
- ·Bullish and bearish divergence
- ·Oscillators in trends vs ranges
Knowing which way a trend points is one thing. Knowing how fast it is moving is another. A car heading north at 20 km/h and a car heading north at 120 km/h are pointed the same way, but they are in very different situations. Momentum is the speedometer of a trend, and the Relative Strength Index, almost always shortened to RSI, is the most popular way to read it.
RSI takes a stock's recent up-days and down-days, weighs them against each other, and squeezes the result onto a simple scale from 0 to 100. Near 100, buyers have utterly dominated lately. Near 0, sellers have. It is a clean, easy-to-read measure of how forceful a move has been, and it never runs off the top or bottom of the chart.
Every charting screen draws the same two dashed lines across the RSI panel: one at 70 and one at 30. And almost every beginner is taught the same tidy sentence to go with them, "above 70, sell; below 30, buy." It is one of the most repeated rules in all of trading, and on 16 years of real Nifty 50 data it is simply wrong. Not "needs a little nuance" wrong. Backwards wrong. The most overbought readings went on to deliver the best returns. Let us see why.
What RSI actually measures
RSI looks back over a window of days, 14 by default, and compares the average size of the up-moves to the average size of the down-moves inside that window. When gains and losses are roughly balanced, RSI sits near the middle, around 50. As up-days take over, it climbs toward 100. As down-days take over, it sinks toward 0. You never have to do any of this maths yourself; your charting software draws the line for you.
Because the scale is capped at 0 and 100, RSI can never run off the chart the way a price can. That is what makes it so handy: a stock trading near 200 rupees and a stock trading near 4,000 rupees can both be read on the very same 0-to-100 ruler.
One quick point that trips up newcomers. The "relative strength" in the name is internal. RSI measures a stock against its own recent history, not against the Nifty or against another stock.
The usual labels: above 70 is called "overbought," below 30 is called "oversold." Those words are perfectly accurate as descriptions. At RSI 75, the stock genuinely has been bought hard. The mistake is treating a description as an instruction.
"Overbought" means strong, not about to fall. "Oversold" means weak, not about to bounce. RSI measures the momentum that has already happened. It does not contain a timer for when that momentum will end.
The number that debunks the rule
We sorted every Nifty 50 day into buckets by its RSI reading, then measured the average return over the next 20 days. The baseline, the drift of any random Nifty 50 day, is +1.48% over 20 days. Here is what each bucket actually delivered:
| RSI bucket | Average return over the next 20 days |
|---|---|
| Below 30 ("oversold") | +1.8% |
| 50 to 70 (normal) | +1.4% |
| 70 to 80 ("overbought") | +1.4% |
| Above 80 (extreme) | +2.2% (positive 60% of the time, the best) |
Read that bottom row again. The most overbought stocks, RSI above 80, sitting in the deepest "sell" zone the textbook recognises, went on to the highest return of any bucket, and were positive 60% of the time. The oversold bucket below 30 did fine too at +1.8%, but the "obvious sell" at the very top was actually the best place to be long, not short.
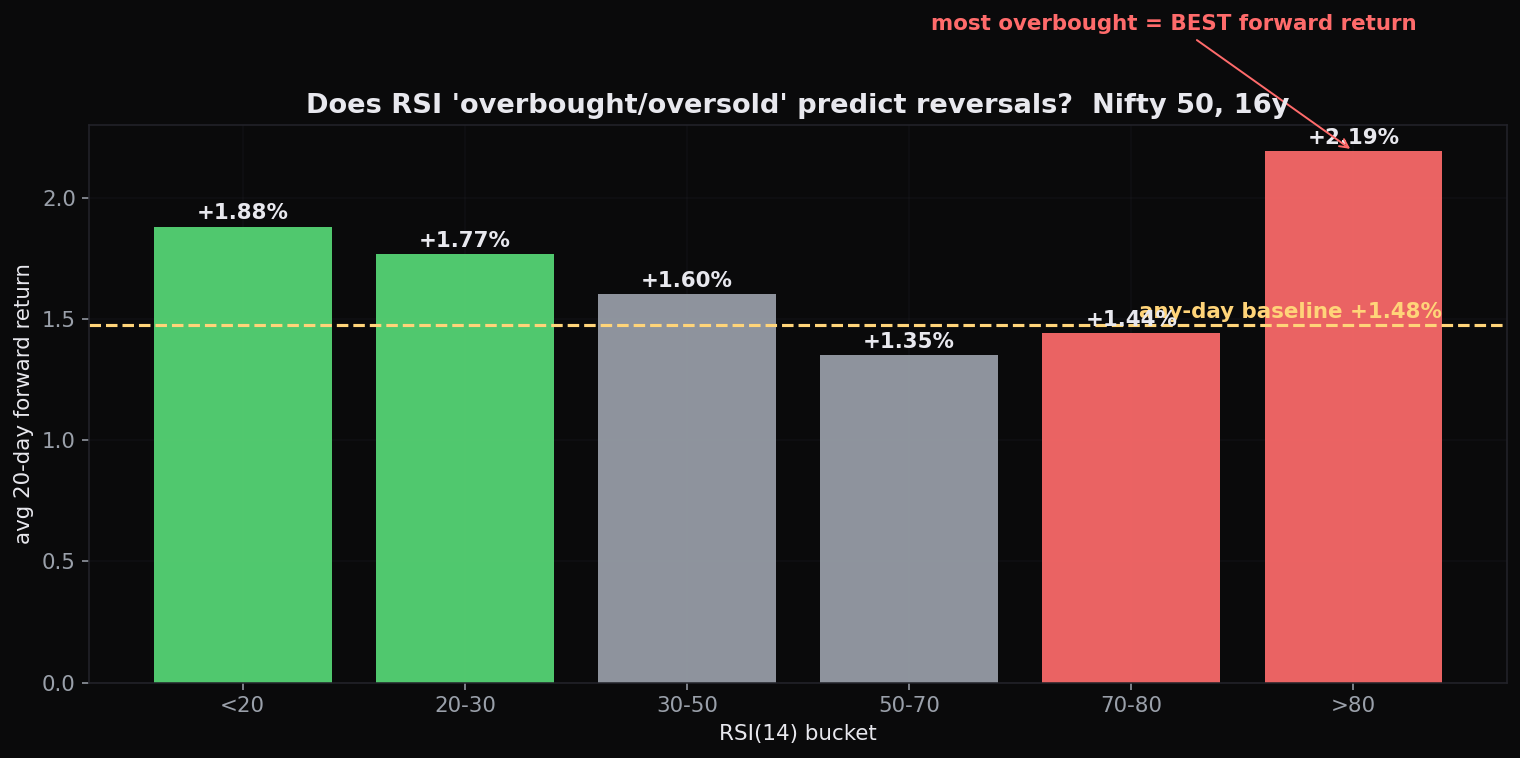
The reason is mechanical. A stock reaches RSI 80 precisely because it is in a powerful uptrend, and strong trends tend to keep trending. Selling strength just because a momentum gauge reads high means betting against the very force the gauge is measuring.
On the Nifty 50, the RSI-above-80 bucket, the "extremely overbought, definitely sell" zone, had the single best return over the next 20 days of every bucket (+2.2%, positive 60% of the time). The cliché "70 equals sell, 30 equals buy" does not survive contact with the data.
Overbought can stay overbought
The other half of the myth is about timing. Even traders who know not to short strength assume "overbought" is a fleeting, one-day flag that flips the moment it appears. It is not. On this data, stretches of RSI above 70 ran as long as 43 days in a row, and stretches below 30 as long as 44 days. A reading is a state a stock can live in for weeks, not a switch that flips the same afternoon.
So a stock can print RSI 75 and keep climbing for a month while you sit waiting for the "sell signal" to pay off. Oversold cuts exactly the same way. Here is Asian Paints driving the point home: on 25 January 2024 its RSI hit 8.7, about as oversold as a major stock ever gets, and the textbook screamed "buy." Over the next 20 days the stock managed only +1.2%, below the +1.48% baseline, and then kept grinding lower. In that one stock, RSI dipped below 30 on 76 separate sessions. "Oversold" was not a rare bottom-fishing signal there; it was the stock's normal condition all the way down.
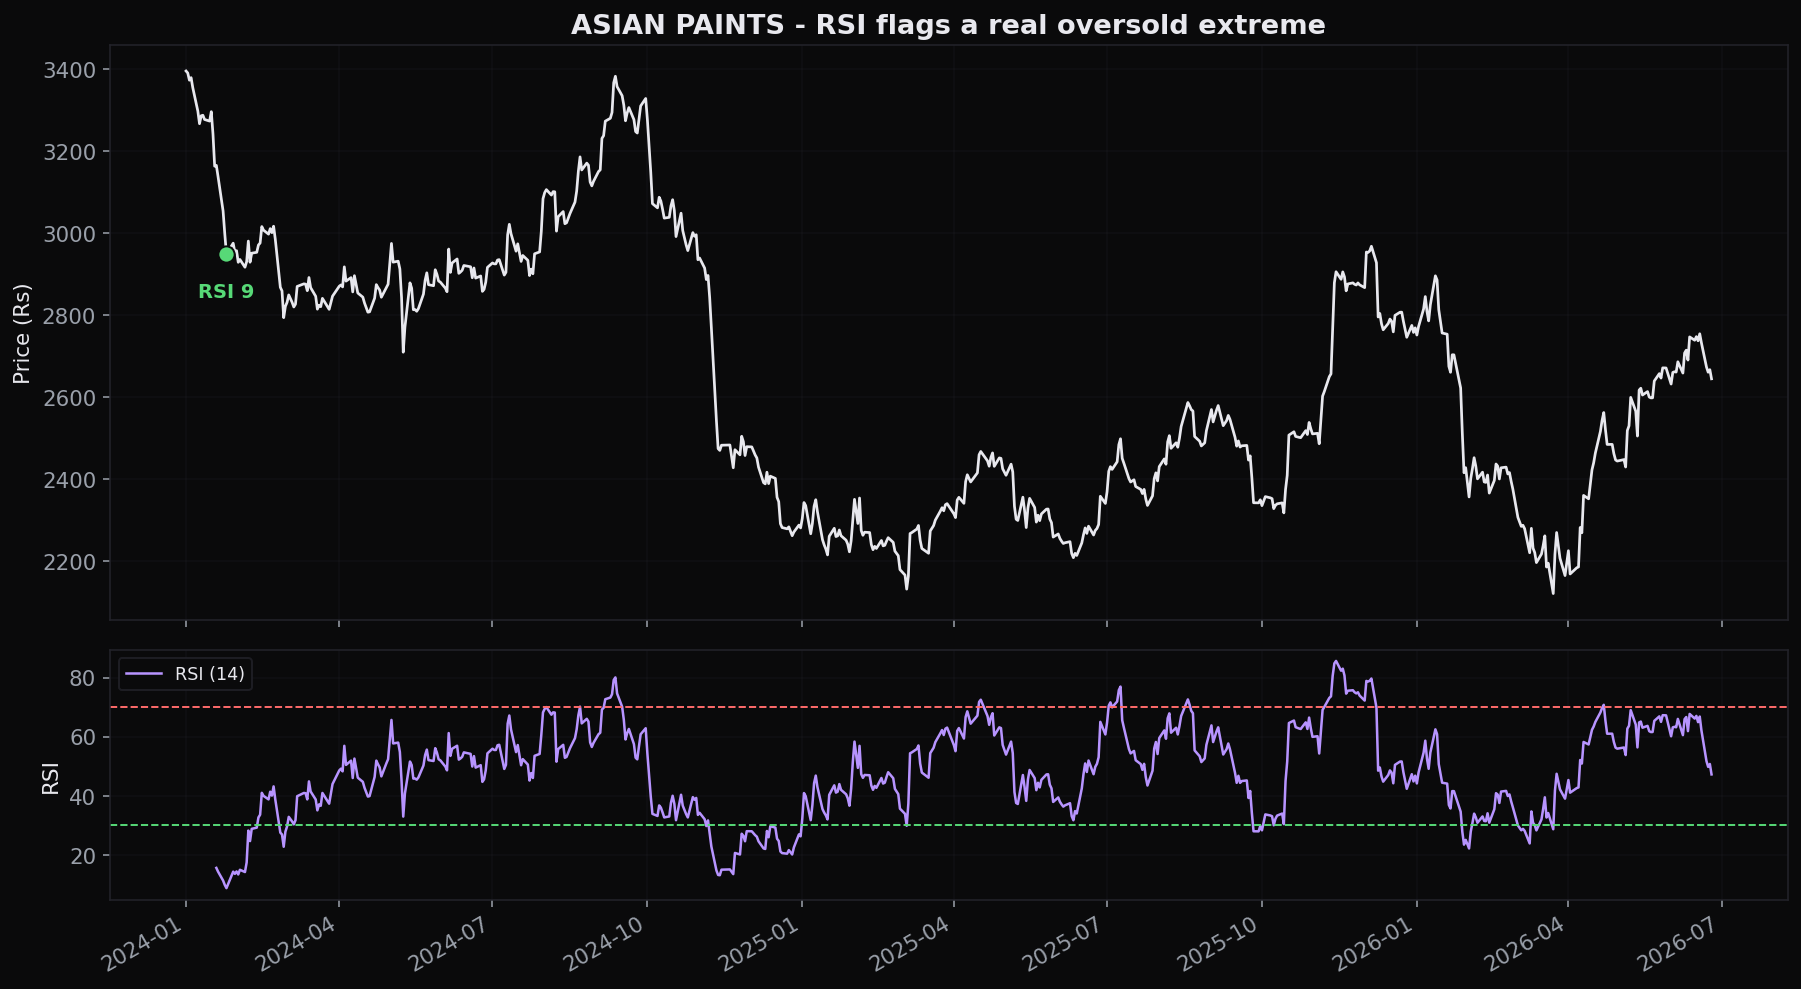
A deeply oversold RSI inside a downtrend is not a bargain. It is confirmation that the trend is strong, to the downside. Buying it because "30 equals buy" is what traders call catching a falling knife. RSI extremes mean nothing until you know the trend they are printing in.
Where RSI earns its keep
If the threshold rule is broken, what is RSI actually good for? Two things.
Divergence. This is RSI's most respected use, and the word just means "disagreement" between price and the indicator. A bearish divergence is when price pushes to a higher high but RSI makes a lower high: the new price peak was reached with less momentum than the last one, a hint the trend is tiring. A bullish divergence is the mirror image: price makes a lower low while RSI makes a higher low, suggesting selling pressure is fading even as price slips. The logic is intuitive. Price set a fresh extreme, but it took less underlying force to get there, so the engine driving the move is quietly losing power.
Two honest cautions about divergence. First, it can persist for a long time before price actually turns; a strong trend can throw off divergence warnings for weeks while it keeps running, so divergence on its own is a notoriously early and unreliable entry. Second, it is best read at the extremes of a move, near a clear support or resistance level, not in the muddled middle of a trend where it means little. Used well, divergence does not name a date. It is an early warning that the force behind a move is weakening, best paired with a price trigger (a broken trendline, a reversal candle) before you act.
Trend versus range. RSI behaves completely differently depending on the kind of market it is in:
- In a range, where price bounces between a floor and a ceiling, RSI swings obediently between its extremes. Here the 70 and 30 levels are more useful as "the rubber band is stretched" markers, though still not standalone triggers.
- In a trend, RSI gets pinned. A healthy uptrend keeps RSI riding the 60-to-80 zone for weeks; a downtrend pins it down in the 20-to-40 zone. Applying range rules to a trending stock is exactly how the "sell at 70" mistake quietly bankrupts a momentum trade.
Some momentum traders even flip the thresholds in a strong trend: in a confirmed uptrend they treat RSI holding above 40 as the sign of health, and a break below 40 as the warning, ignoring the 70 line entirely. You do not have to adopt that exact rule, but it captures the right instinct. The meaning of any RSI level depends entirely on the regime it is printing in.
The simplest way for a beginner to use RSI: read it as context, never as a trigger. First decide the trend from price. If the trend is up, ignore overbought readings and instead watch for shallow RSI dips and bullish divergence as continuation cues. If the trend is sideways, treat a stretched RSI as a "this leg is extended" caution near the edges of the range. Let price give the entry; let RSI describe the momentum behind it.
Tuning the lookback
That default window of 14 days is just a dial you can turn. A shorter setting, say 7, reacts faster and hits the extremes more often, which means more signals and more noise. A longer setting, say 21, is slower and smoother, with fewer, more deliberate swings. It is the same trade-off you met with moving averages: more responsiveness bought with more false alarms. Most traders leave it at 14, not because 14 is magic, but because it is the shared default everyone else is reacting to. Whatever you pick, the interpretation never changes: the levels describe a state, not an order to act.
RSI's cousins: the other momentum oscillators
RSI is not alone. It belongs to a small family of tools called oscillators, named because they swing back and forth between two extremes like a pendulum. Each one measures momentum in a slightly different way, but they all share RSI's most important warning: overbought is not a sell, and oversold is not a buy. Meet the cousins.
The Stochastic asks a clever little question: where does today's close sit within the recent high-to-low range? If the stock keeps closing near the top of its range, buyers are firmly in control; near the bottom, sellers are. It plots two lines, a faster one and a slower one, on a 0-to-100 scale, with above 80 called overbought and below 20 oversold. Here it is on Hindustan Unilever.
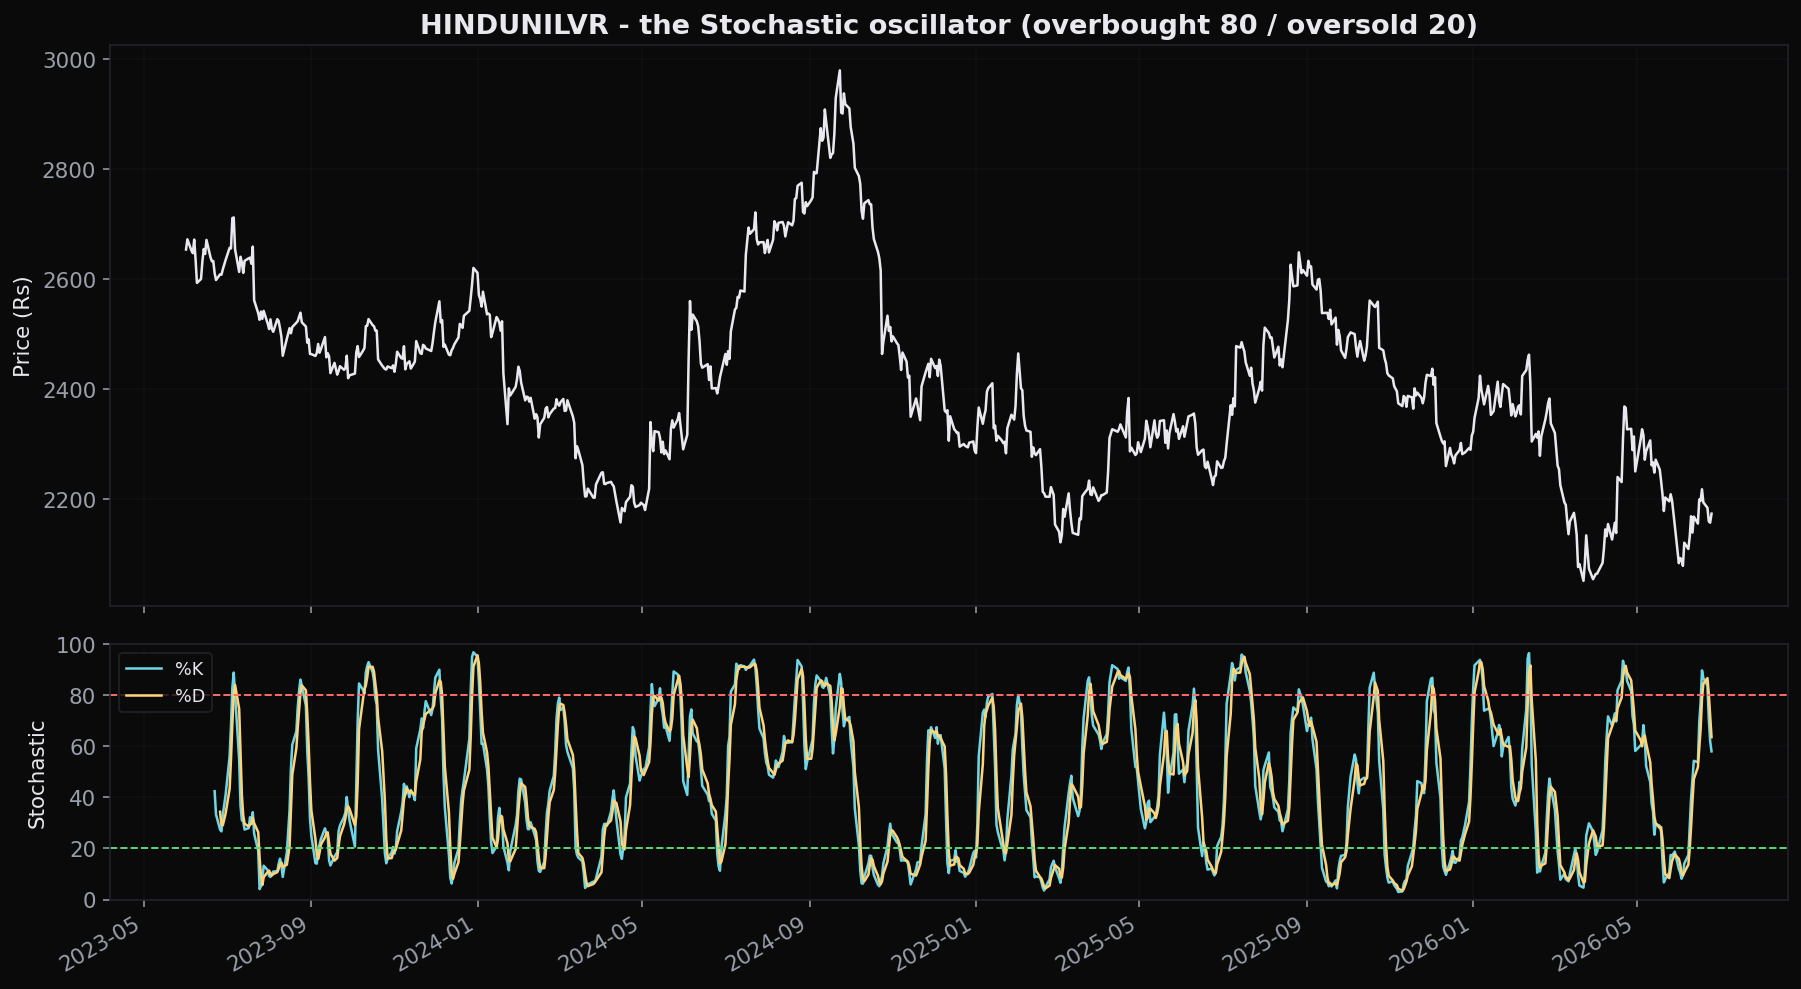
Notice how the Stochastic can sit jammed up against its ceiling while the stock keeps rising. That is the exact same trap as RSI: an extreme reading in a strong trend is a sign of strength, not an imminent reversal.
The Williams %R is essentially the Stochastic turned upside down. It runs on a scale from 0 down to -100, where readings near the top mean the stock is strong (overbought) and readings near the bottom mean it is weak (oversold). Same idea, flipped scale.
The CCI, short for Commodity Channel Index, measures how far price has wandered from its own recent average. Despite the "commodity" in its name, traders use it on stocks all the time. Unlike RSI, it is not capped at 0 and 100, so it can spike to large positive or negative values; readings around plus or minus 100 are the usual reference points for "stretched."
The Stochastic RSI is the most sensitive of the bunch. It is, quite literally, a Stochastic calculated on the RSI line instead of on price, an indicator of an indicator. That makes it react very fast and hit its extremes constantly, which means even more signals and even more noise than plain RSI.
Do not mistake five oscillators agreeing for five independent opinions. RSI, Stochastic, Williams %R, CCI and Stochastic RSI are all reading the same recent price action in slightly different costumes. When they all flash "overbought" together, that is one observation wearing five hats, not five reasons to sell. They all share RSI's caveat, and stacking them does not remove it.
Quick recap
- RSI puts momentum on a 0-to-100 scale, comparing recent up-moves against down-moves over a window (14 days by default). Your software does the maths.
- "70 equals sell, 30 equals buy" is false on this data: the RSI-above-80 bucket had the best return over the next 20 days (+2.2%, positive 60% of the time); oversold below 30 returned +1.8%.
- Overbought and oversold are states, not switches: stretches ran up to 43 days (overbought) and 44 days (oversold); Asian Paints hit RSI 8.7 and still fell.
- RSI's real value is divergence (momentum quietly fading against price) and regime context (it rides high in uptrends, low in downtrends).
- The Stochastic, Williams %R, CCI and Stochastic RSI are cousins that read the same momentum in different ways, and all share RSI's "overbought is not a sell" caveat. They can stay pinned at an extreme through an entire trend.
RSI and its cousins read momentum but say nothing about the trend they are riding. The MACD tries to do both at once, blending two moving averages into a single momentum-and-trend tool. Next we build it, read its crossover, and measure how often that famous signal is actually worth acting on.