How Strong Is the Trend? ADX, DMI and Aroon
Direction is only half the story; strength is the other half. The ADX, DMI and Aroon tell you whether a trend has real force behind it or is just drifting, so you know when a trend tool will work and when it will whipsaw.
- ·Direction vs strength
- ·Reading the ADX and the 25 line
- ·DMI: the +DI and -DI lines
- ·The Aroon up and down
- ·Strong trend vs choppy range
- ·Using strength as a filter
Two stocks both go up 10% over a month. One climbs in a smooth, determined staircase, every week a little higher, almost no pullbacks. The other lurches up, falls back, chops sideways, then finally limps to the same place. They ended at the same price, but they are not the same stock to trade. The first has a strong trend; the second barely has a trend at all. Until now this course has taught you to read direction, which way price is leaning. This chapter teaches the other half of the story, strength, how much force is actually behind that lean.
Strength matters for a very practical reason. Almost every trend-following tool you have met, moving averages, the MACD, the crossovers, only works when a real trend exists. Drop those same tools into a sideways, drifting market and they whipsaw you to pieces, firing buy and sell signals that go nowhere. So before you trust any trend tool, you want a separate gauge that answers a blunt question: is there a trend here at all, and is it strong or feeble? Three indicators do exactly that, the ADX, the DMI it is built from, and Aroon. None of them is a buy or sell button. Together they are the filter that tells you when your other tools will work.
Direction and strength are two different things
Picture a car. Direction is which way it is pointing, north or south. Strength is how fast it is actually moving. A car can point dead north and be parked at a red light, going nowhere. A stock is the same. It can be pointing up, your moving average sloping gently higher, while barely moving with any conviction, drifting in a tight, choppy range that will chop up any trend trade you put on.
This is the single most useful idea in the chapter, so hold onto it. Direction tells you which way; strength tells you whether to bother. A weak, directionless market is where trend strategies go to die, not because the direction is wrong but because there is not enough force to carry a move far enough to pay you. The tools below are not trying to predict the future. They are measuring the present with one question in mind: how much force is in this move right now.
The ADX: a strength meter
The Average Directional Index, or ADX, is the headline strength gauge. It was built by Welles Wilder, the same engineer behind RSI and the ATR, and it does something deliberately one-sided: it measures how strong a trend is, on a scale of 0 to 100, while telling you absolutely nothing about which way that trend points. A high ADX in a falling stock and a high ADX in a rising stock look identical. ADX is direction-blind on purpose.
The numbers that matter are simple rules of thumb, not laws:
- ADX below 20, the trend is weak or absent; the stock is chopping sideways. This is the danger zone for trend tools.
- ADX above 25, a real trend has taken hold, up or down; trend-following tools have something to grip.
- ADX rising, whatever trend exists is gaining force, regardless of direction.
- ADX above 40 or so, the trend is very strong, and may be getting mature.
On the chart below, BEL's ADX rose above the 25 line on 7 August 2024 as its uptrend gathered real force, and went on to peak near 48, marking one of the most powerful stretches of the move. Notice that the ADX line itself never tells you the move is up; for that you read the price, or the two helper lines we meet next.
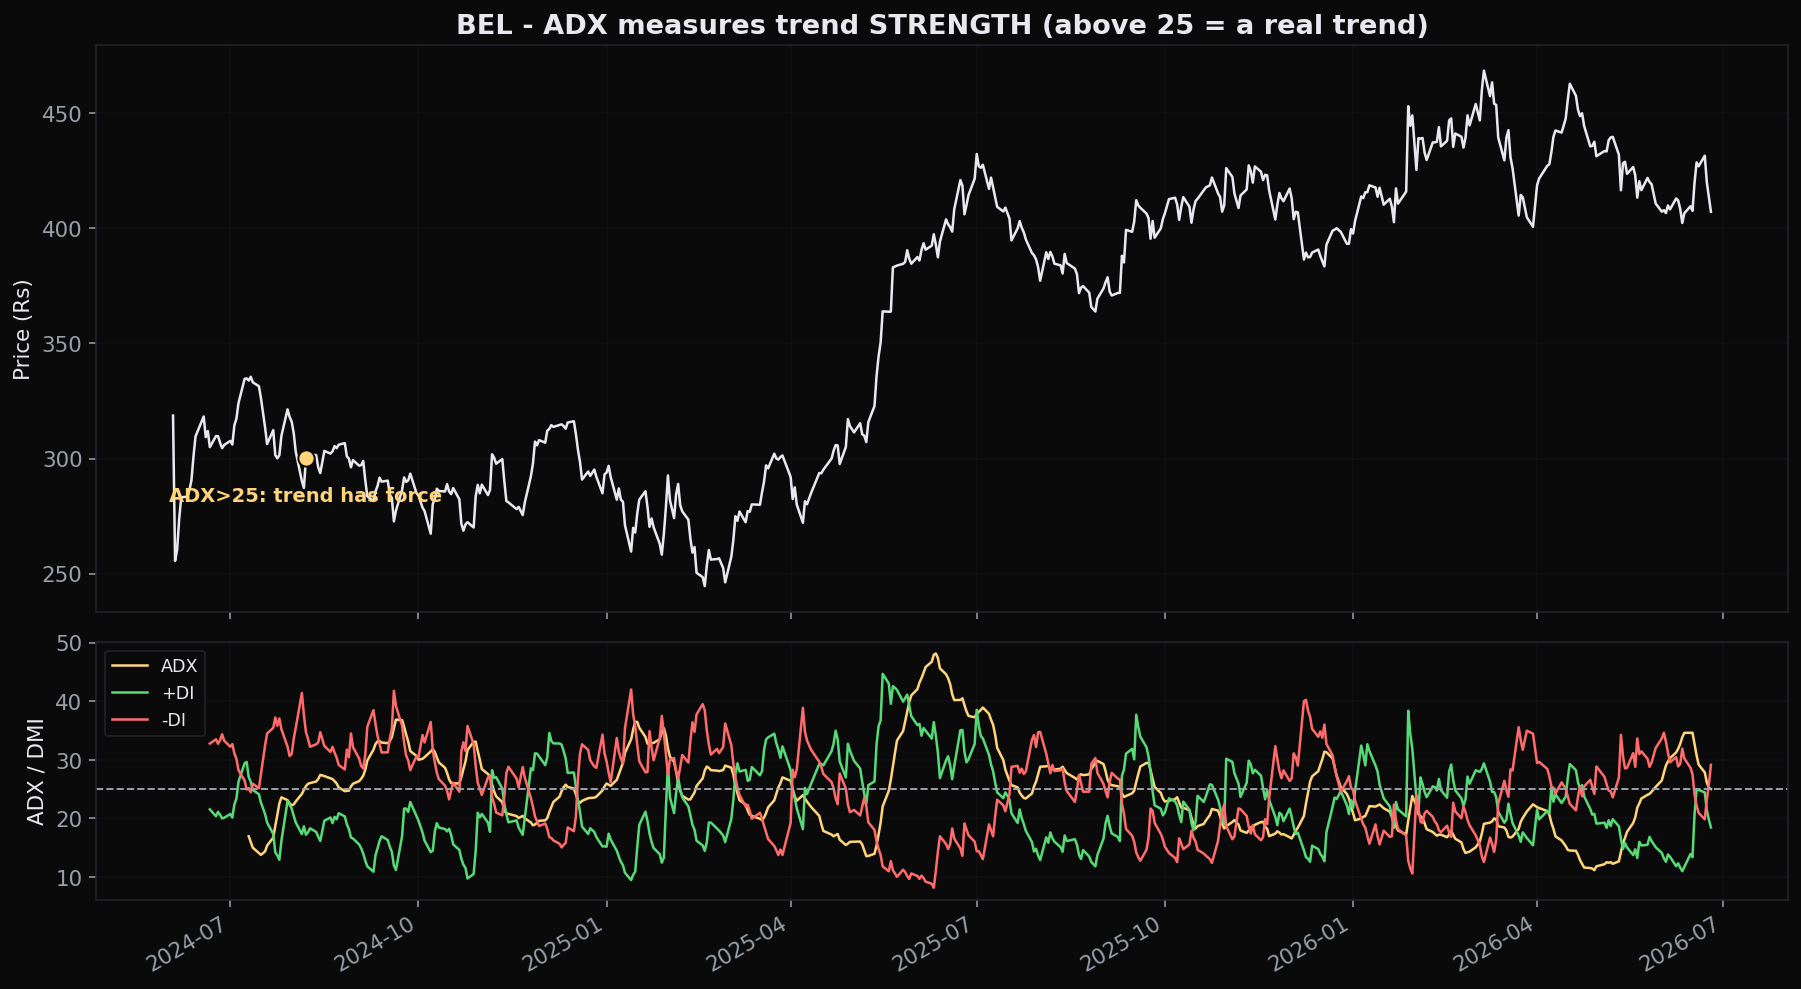
The ADX answers how strong, never which way. A rising ADX means the current trend is gaining power whether the stock is soaring or sinking. Read the ADX for force, and read price or the directional lines for direction. Never expect a single line to do both jobs.
The DMI: where the direction hides
The ADX does not appear out of thin air. It is calculated from a pair of lines called the Directional Movement Index, or DMI, and those two lines are where the direction the ADX refuses to give you actually lives.
The DMI splits a stock's movement into two forces. The Plus DI line measures upward pressure, how much of recent movement has been to new highs. The Minus DI line measures downward pressure, how much has been to new lows. On a chart they are usually drawn as a green line and a red line riding together, and you read them as a contest:
- When Plus DI is above Minus DI, buyers are in control; the direction is up.
- When Minus DI is above Plus DI, sellers are in control; the direction is down.
- The wider the gap between the two lines, the more lopsided the contest, and a wider gap is exactly what drives the ADX higher.
So the full picture clicks together. The DMI tells you the direction, which line is on top, and the ADX, distilled from how far apart those lines are, tells you the strength. A common reading combines them: a Plus DI crossing above Minus DI while the ADX is above 25 is a far more trustworthy up-signal than the same cross while the ADX is languishing below 20, where it is probably just noise.
On BEL through that 2024 advance, the green Plus DI line sat clearly above the red Minus DI line, telling you the direction was up, while the ADX climbing toward 48 told you the up-move had unusual force. Direction from the DMI, strength from the ADX, the two questions answered by two readings on the same panel.
Aroon: how fresh is the trend
Aroon comes at strength from a different and rather clever angle: time. Instead of measuring the size of moves, it measures how recently the stock set a new high or a new low. The name means dawn in Sanskrit, the idea being to catch the early light of a new trend.
It has two lines, both on a 0 to 100 scale:
- Aroon Up measures how recently the stock made a new high over the lookback window. If it just printed a fresh high today, Aroon Up sits near 100. The longer ago the last high, the lower it falls.
- Aroon Down does the mirror image for new lows.
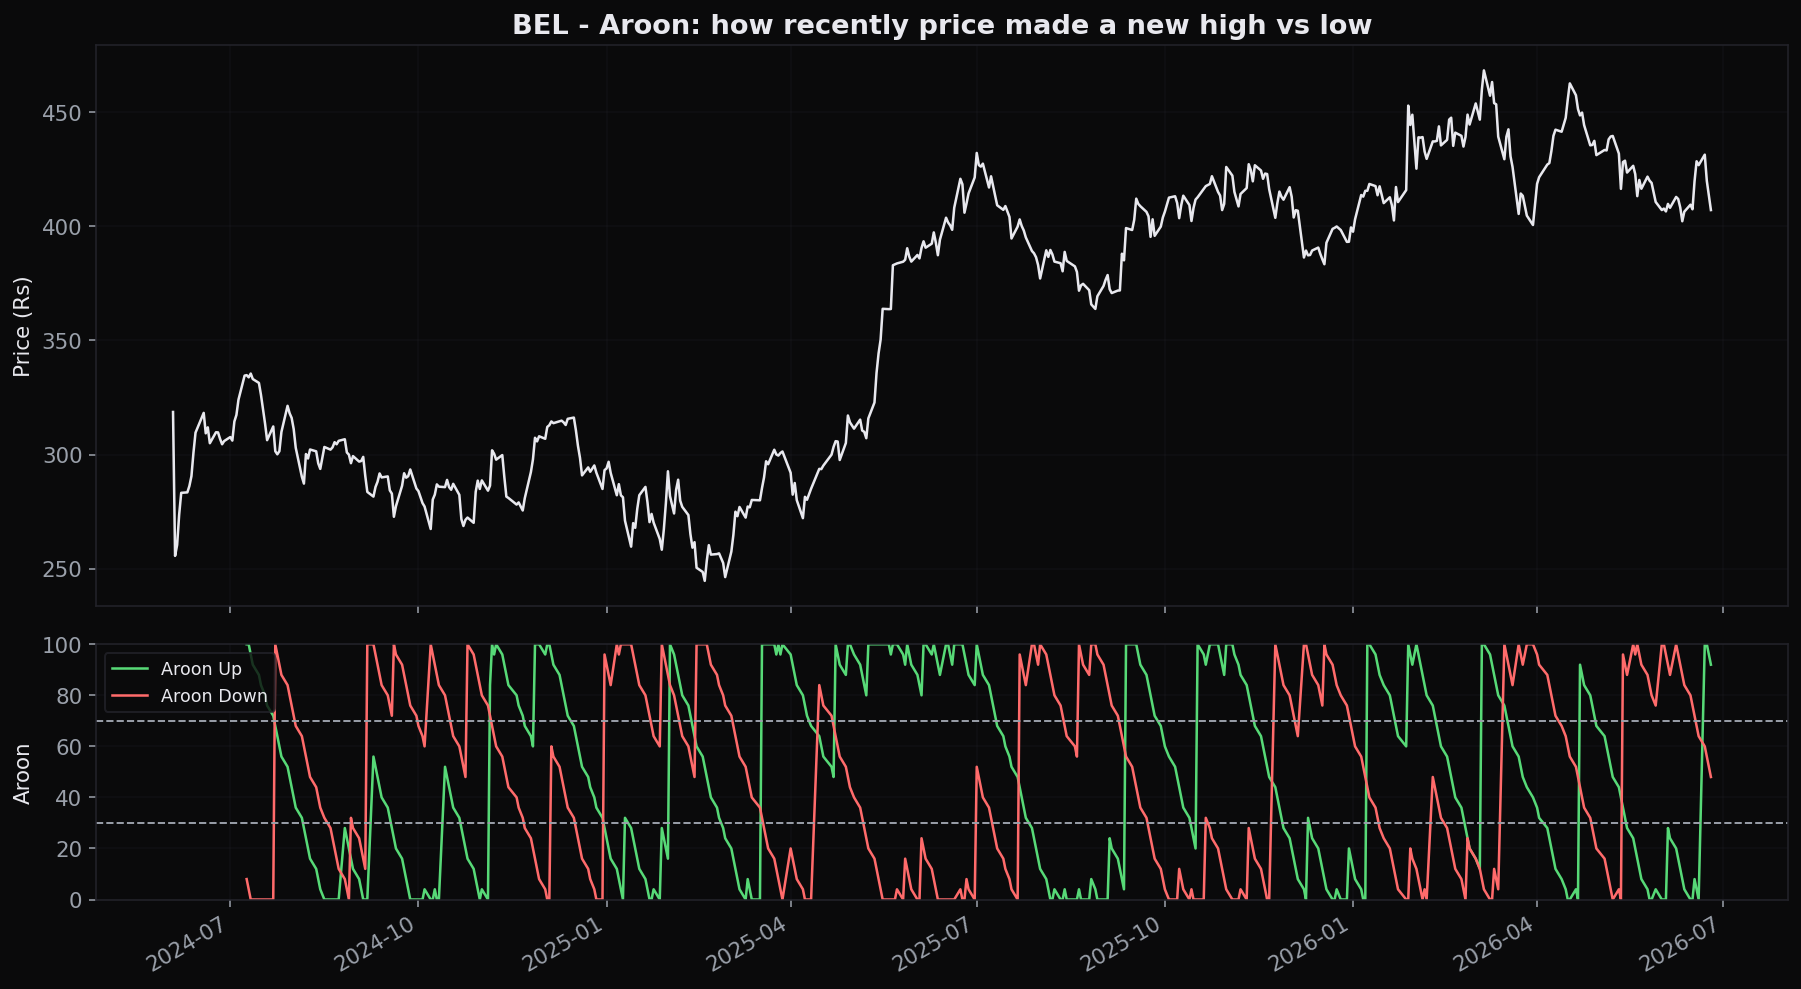
The readings are intuitive once you see them in action. On the chart below, BEL shows Aroon Up pinned near 100 with Aroon Down down near the floor. That combination has a clear meaning: the stock keeps making brand-new highs and has not made a new low in ages, the unmistakable signature of a strong, fresh uptrend. When the two lines cross and swap places, Aroon Down climbing as Aroon Up fades, the trend is changing hands. And when both lines drift around the middle together, neither making decisive new highs nor lows, the stock is going nowhere, the same sideways warning the ADX gives below 20.
Strong trend vs choppy range
Step back and all three tools are really sorting the market into two states. In one state a trend is present and powerful: ADX above 25 and rising, the two DMI lines spread wide apart, Aroon pinned at an extreme. In the other state the market is just chopping: ADX stuck below 20, the DMI lines tangled together crossing back and forth, Aroon lines drifting around the middle. Knowing which state you are in is more valuable than any single signal, because it decides which kind of tactic has a chance of working at all.
A choppy, low-ADX range is where trend strategies bleed the most. The crossovers fire constantly and reverse just as fast, handing you a string of small losses. If your trend tool keeps whipsawing, the problem is usually not the tool, it is that you are using a trend tool in a market that has no trend.
Using strength as a filter
Here is the real payoff, and it changes how you use everything you have learned. A strength gauge is best used not as a signal on its own but as a filter, a green light that decides whether your other tools are even allowed to play. A clean, beginner-friendly way to wire it up:
- When ADX is above 25, a trend exists, so let your trend tools lead, moving averages, the MACD, the trend-following systems in the next chapter, and trust their signals more.
- When ADX is below 20, treat the market as a range; switch off the trend tools and lean on range tactics instead, watching support and resistance, and remembering that overbought and oversold readings behave very differently in a range than in a trend.
This filter is exactly why this chapter sits where it does. It does not generate trades. It tells you which playbook to open. There are two honest cautions to carry, though. First, the ADX is a smoothed, averaged number, so it lags; by the time it confirms a strong trend, a good part of the move is often already behind you. Second, a very high ADX is not a promise of more; a reading up near 40 to 50 can mark a trend at its most stretched, right before it tires, which is precisely why ADX is a context filter and not a timing tool. And remember from the data ethos of this course that filters like these tend to cut your time in the market and your drawdowns, at a real cost to raw returns, they make you safer and more selective, not richer by magic.
If you take one habit from this chapter, make it this: before you act on any trend signal, glance at the ADX. Above 25, the trend is real, so trust the signal. Below 20, the market is just drifting, so ignore the trend signal entirely and wait. That one check filters out a huge share of the worst whipsaw trades a beginner makes.
Quick recap
- Direction and strength are different questions. Direction is which way price leans; strength is how much force is behind it. A stock can point up and barely move.
- The ADX measures strength only, on a 0 to 100 scale, with no direction. Below 20 is chop; above 25 is a real trend. On BEL it crossed above 25 on 7 August 2024 and peaked near 48.
- The DMI holds the direction the ADX leaves out: Plus DI above Minus DI means up, the reverse means down, and the gap between them feeds the ADX.
- Aroon measures how recently new highs and lows were set; Aroon Up near 100 with Aroon Down low marks a strong, fresh uptrend, and a cross signals a change.
- Use strength as a filter, not a signal: let trend tools lead when ADX is above 25, and stand down when it is below 20. Mind the lag, and that a very high ADX can flag a stretched move.
You now know when a trend is strong enough to trade. The next chapter introduces tools built to ride those trends, indicators that sit right on the price and flip from buy to sell for you, the Supertrend, the Parabolic SAR and the Ichimoku Cloud, and shows exactly where each one gets chopped up when the strength you just learned to measure runs dry.